What is the function of logistic regression?
Logistic regression is a statistical method used for binary classification, which means it's employed when the dependent variable or outcome variable is categorical and has only two possible values, typically coded as 0 and 1. The primary function of logistic regression is to model the relationship between a set of independent variables (predictors or features) and the probability of an event occurring.
Here's how logistic regression works and its key functions:
Modeling Probability:
- Logistic regression models the probability of an event happening. In binary classification, this event is often referred to as the "success" or "positive" outcome, which is coded as 1, while the opposite outcome is coded as 0. For example, predicting whether an email is spam (1) or not spam (0) based on various features.
Logit Transformation:
- Logistic regression uses the logit transformation to model the linear relationship between the independent variables and the log-odds of the event occurring. The log-odds (logit) is a continuous value that can take any real number.
Linear Combination of Predictors:
- Logistic regression calculates a linear combination of the independent variables, each weighted by a coefficient (slope). This linear combination is then transformed into the log-odds using the logistic function (sigmoid function), which maps values to a range between 0 and 1.
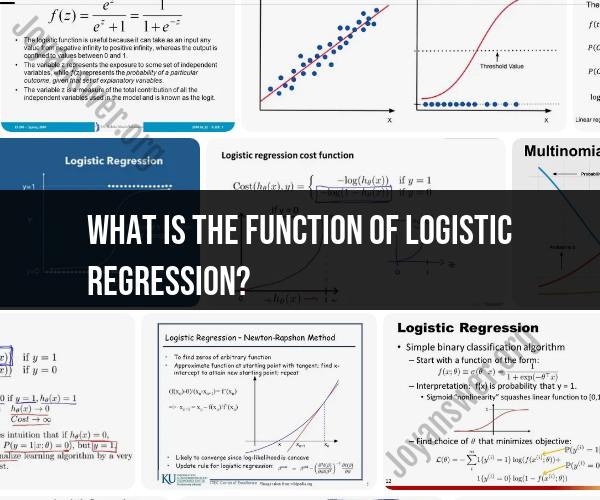
Sigmoid Function:
- The sigmoid function is an S-shaped curve that takes the linear combination of predictors and converts it into a probability value between 0 and 1. This curve is characterized by its ability to rapidly change from 0 to 1 around a certain threshold, making it suitable for binary classification.
Decision Boundary:
- The logistic regression model establishes a decision boundary (often at a probability threshold of 0.5) to classify data points into one of the two categories. Data points with predicted probabilities greater than or equal to 0.5 are classified as 1, while those with probabilities less than 0.5 are classified as 0.
Coefficient Interpretation:
- The coefficients in logistic regression represent the change in the log-odds of the event occurring for a one-unit change in the corresponding independent variable, holding all other variables constant. These coefficients can be used to understand the influence of each predictor on the probability of the event.
Model Assessment and Prediction:
- Logistic regression models can be assessed using various metrics like accuracy, precision, recall, F1-score, and ROC-AUC. These metrics help evaluate the model's performance in predicting the binary outcomes. Logistic regression can then be used for making predictions on new, unseen data.
Regularization:
- Logistic regression can be regularized to prevent overfitting by adding penalty terms to the cost function. Common regularization techniques include L1 regularization (Lasso) and L2 regularization (Ridge).
Logistic regression is widely used in various fields, including healthcare (e.g., disease prediction), finance (e.g., credit scoring), marketing (e.g., customer churn prediction), and natural language processing (e.g., sentiment analysis). Its ability to model the probability of binary outcomes and provide interpretable coefficients makes it a valuable tool for predictive modeling and decision-making.
The Function of Logistic Regression: A Comprehensive Explanation
Logistic regression is a statistical model that is used to predict the probability of a binary outcome. For example, logistic regression could be used to predict the probability of a customer clicking on an ad, the probability of a patient having a disease, or the probability of a student passing a test.
Logistic regression works by fitting a logistic function to the data. The logistic function is a sigmoid curve that ranges from 0 to 1. The output of the logistic function is interpreted as the probability of the event happening.
To train a logistic regression model, you need to provide the model with a set of training data. The training data should consist of input features and the target variable. The input features are the variables that you think are predictive of the target variable. The target variable is the variable that you want to predict.
Once the logistic regression model is trained, you can use it to predict the probability of the event happening for new data points. To do this, you simply input the new data point into the model and the model will output the probability of the event happening.
Logistic Regression Demystified: Understanding Its Purpose and Use
Logistic regression is a powerful tool that can be used to solve a wide variety of problems in machine learning. It is relatively easy to understand and implement, and it is often used as a baseline model for other machine learning algorithms.
Here are some examples of how logistic regression can be used:
- Predicting the likelihood of a customer converting: A company can use logistic regression to predict the likelihood of a customer converting (e.g., making a purchase, signing up for a newsletter, etc.). This information can then be used to target marketing campaigns and improve customer retention.
- Detecting fraud: Financial institutions can use logistic regression to detect fraudulent transactions. Logistic regression can be used to identify patterns in fraudulent transactions that would be difficult for humans to spot.
- Diagnosing diseases: Doctors can use logistic regression to diagnose diseases. Logistic regression can be used to identify patterns in patient symptoms that are associated with different diseases.
Statistical Analysis Made Easy: The Role of Logistic Regression
Logistic regression is a valuable tool for statistical analysis. It can be used to identify relationships between variables and to make predictions about future events.
Here are some of the benefits of using logistic regression for statistical analysis:
- Logistic regression is easy to interpret: The output of the logistic regression model is interpreted as the probability of the event happening. This makes it easy to understand the results of the model and to make informed decisions.
- Logistic regression is robust: Logistic regression is a robust model that can handle noisy data and outliers. This makes it a good choice for real-world data sets.
- Logistic regression is versatile: Logistic regression can be used to solve a wide variety of problems, from predicting customer behavior to detecting fraud.
Overall, logistic regression is a powerful and versatile tool for statistical analysis. It is easy to understand and implement, and it can be used to solve a wide variety of problems.
If you are interested in learning more about logistic regression, there are many resources available online and in libraries. You can also find many tutorials and examples of logistic regression code in different programming languages.