What are test statistics?
Test statistics are a fundamental concept in statistical hypothesis testing. They are numerical values calculated from sample data to determine whether an observed effect or relationship is statistically significant. Test statistics serve as the basis for making decisions about the validity of hypotheses and drawing conclusions from data. Here's a more detailed explanation:
Purpose: Test statistics help assess the evidence in favor of or against a particular hypothesis. In hypothesis testing, you typically have a null hypothesis (H0), which represents a default or no-effect assumption, and an alternative hypothesis (Ha), which represents the effect you want to test. The test statistic quantifies how well the sample data support the alternative hypothesis.
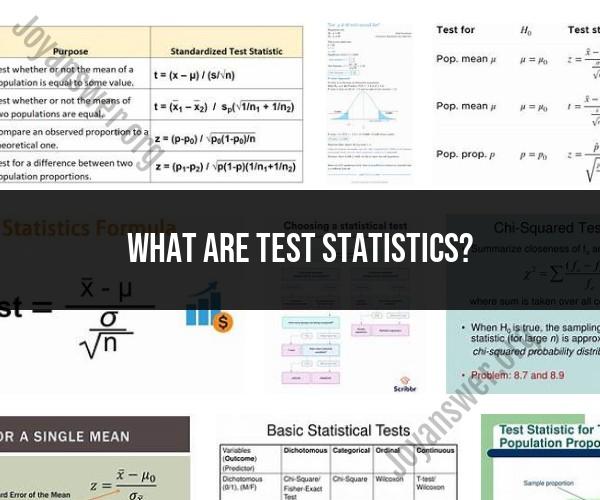
Calculation: The specific calculation of the test statistic depends on the type of statistical test being used. Different tests have different formulas, such as t-tests, chi-square tests, F-tests, z-tests, and many others. These formulas are designed to summarize the relevant information from the sample data in a single numerical value.
Comparison to a Critical Value or p-value: Once you have calculated the test statistic, you compare it to a critical value from a statistical table or compute its associated p-value. The critical value represents a threshold beyond which you reject the null hypothesis. The p-value indicates the probability of obtaining results as extreme as, or more extreme than, those observed if the null hypothesis were true. A smaller p-value suggests stronger evidence against the null hypothesis.
Decision Rule: Based on the comparison to the critical value or p-value, you make a decision. If the test statistic falls in the critical region (beyond the critical value) or if the p-value is smaller than a predetermined significance level (alpha), you reject the null hypothesis. If the test statistic falls in the non-critical region or if the p-value is greater than alpha, you fail to reject the null hypothesis.
Interpretation: Rejecting the null hypothesis implies that there is significant evidence in favor of the alternative hypothesis, suggesting that the observed effect or relationship is statistically significant. Failing to reject the null hypothesis means that there is not enough evidence to support the alternative hypothesis.
Type I and Type II Errors: Hypothesis testing involves the possibility of two types of errors. A Type I error occurs when you incorrectly reject a true null hypothesis. A Type II error occurs when you fail to reject a false null hypothesis. The significance level (alpha) and power of a test are used to control the probabilities of these errors.
In summary, test statistics are critical tools in statistical hypothesis testing, allowing researchers and analysts to make informed decisions about hypotheses based on sample data. They help determine whether observed effects are likely due to random chance or if they represent meaningful and statistically significant relationships or differences.