What is the total area under the normal distribution curve?
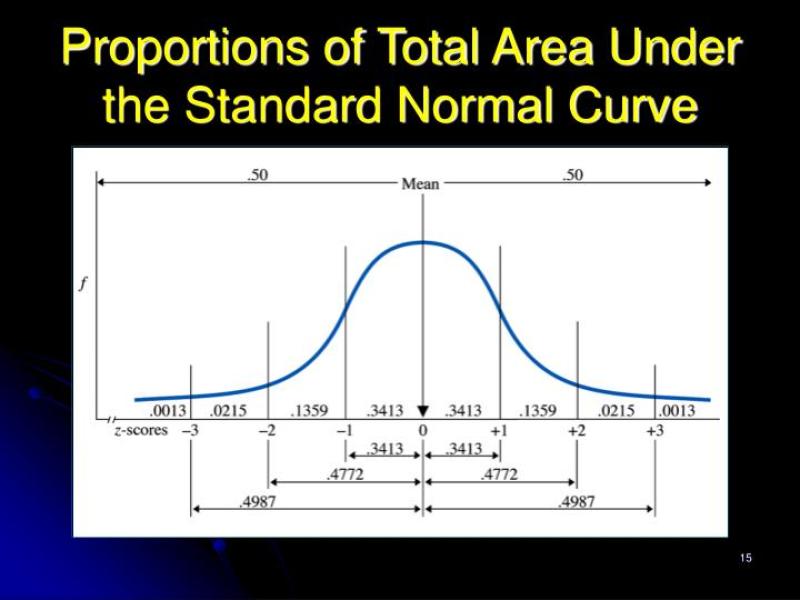
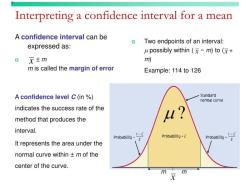
The total area under the normal distribution curve is always equal to 1. The normal distribution, often referred to as the bell curve or Gaussian distribution, is a continuous probability distribution characterized by a symmetric, bell-shaped curve.
The total area under the curve represents the total probability of all possible outcomes within the distribution. Since the normal distribution is defined for all real numbers, the curve extends indefinitely in both directions along the x-axis. The area under the entire curve, from negative infinity to positive infinity, is considered to be 1, indicating 100% probability.
This property of the normal distribution is a fundamental aspect of probability theory. The distribution is fully characterized by two parameters:
- Mean (): The center of the distribution.
- Standard Deviation (): The measure of the spread or variability of the distribution.
These parameters determine the shape and scale of the normal distribution curve. Different normal distributions with different means and standard deviations can be standardized to the standard normal distribution, which has a mean of 0 and a standard deviation of 1. In the standard normal distribution, the total area under the curve is also 1.
When working with specific intervals or ranges on the normal distribution curve, probabilities can be determined by finding the area under the curve within those intervals. This is often done using statistical tables or software to find the cumulative probability associated with certain z-scores (standardized scores). The area under the curve represents the probability of observing a value within that interval.
Statistical distribution analysis: What is the total area under the normal distribution curve?
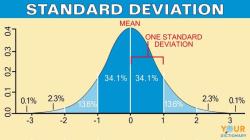
The total area under the normal distribution curve, also known as the Gaussian distribution, is always equal to 1. This means that there is a 100% probability that a randomly selected variable from a normal distribution will fall within some range of values. The normal distribution is a bell-shaped curve that is symmetrical about its mean, which is the most likely value for the variable. The standard deviation of the normal distribution determines the spread of the curve, with a larger standard deviation indicating a wider spread and a smaller standard deviation indicating a narrower spread.
Exploring the concept of the normal distribution curve and its total area
The normal distribution is a very important concept in statistics because it can be used to model many real-world phenomena, such as the heights of people, the scores on a standardized test, or the errors in measurement. The total area under the normal distribution curve being equal to 1 is a fundamental property of the curve and is used to calculate probabilities for various ranges of values. For example, if we know that the heights of people in a population follow a normal distribution with a mean of 60 inches and a standard deviation of 3 inches, we can use the normal distribution curve to calculate the probability that a randomly selected person from that population will be taller than 63 inches.
Tips for students and researchers in statistical analysis using the normal distribution curve
Here are some tips for students and researchers in statistical analysis using the normal distribution curve:
Understand the properties of the normal distribution curve: Familiarize yourself with the key features of the normal distribution, such as its symmetry, its relationship to the mean and standard deviation, and the total area under the curve being equal to 1.
Use the normal distribution curve to calculate probabilities: Learn how to use the standard normal distribution table or a statistical calculator to find probabilities for various ranges of values under the normal distribution curve.
Apply the normal distribution to real-world problems: Be able to identify situations where the normal distribution can be used to model real-world data and use the curve to make inferences about the data.
Utilize statistical software effectively: Learn how to use statistical software packages to perform calculations and visualizations related to the normal distribution curve.
