How to calculate stats from a frequency table?
Calculating statistics from a frequency table involves using the information provided to determine various measures such as measures of central tendency (mean, median, mode) and measures of dispersion (range, variance, standard deviation). Here's a general process:
Measures of Central Tendency:
Mean (Average):
- If the frequency table includes individual data values and their frequencies:
- Multiply each value by its frequency.
- Sum up these products.
- Divide the total by the sum of frequencies.
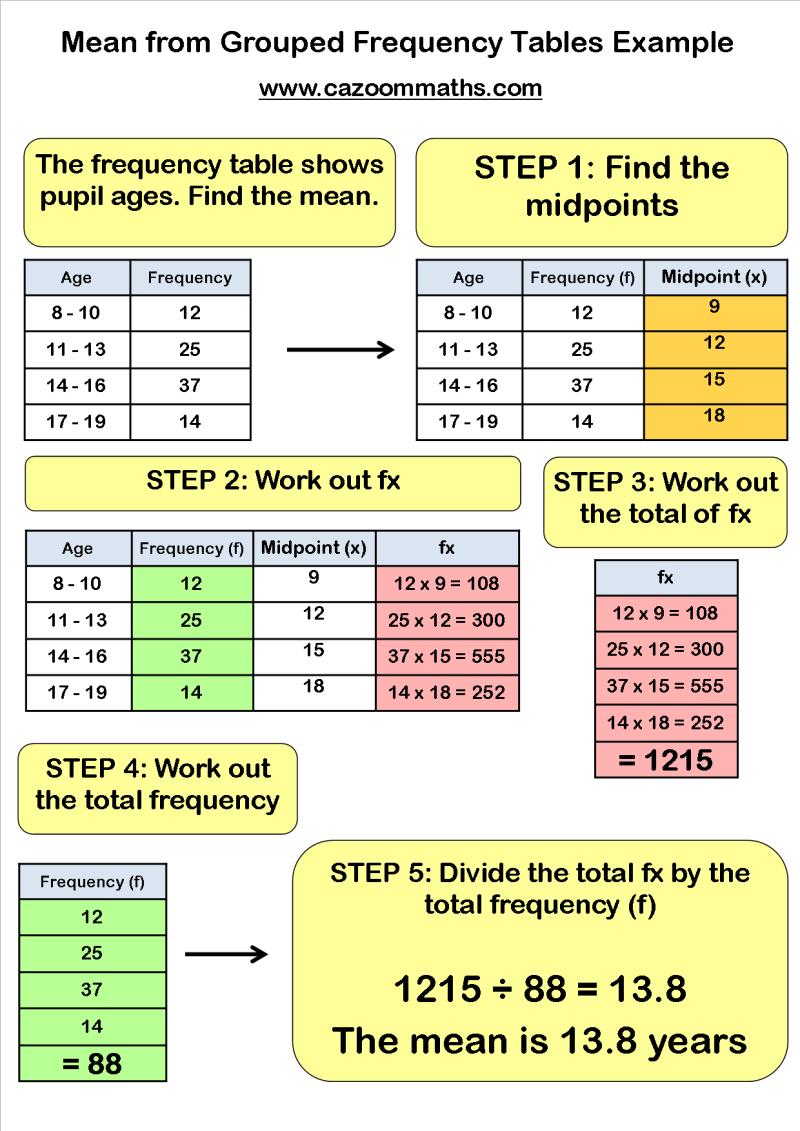
- If the table shows grouped data (class intervals and frequencies):
- Calculate the midpoint of each class interval.
- Multiply each midpoint by its frequency.
- Sum up these products.
- Divide the total by the sum of frequencies.
- If the frequency table includes individual data values and their frequencies:
Median (Middle Value):
- For grouped data:
- Find the cumulative frequency.
- Locate the median class (where the cumulative frequency crosses half of the total frequencies).
- Use the median formula for grouped data: Median = L + [(N/2 - CF) / f] * w, where L is the lower boundary of the median class, N is the total frequency, CF is the cumulative frequency before the median class, f is the frequency of the median class, and w is the class width.
- For grouped data:
Mode (Most Common Value):
- For grouped data, the mode is the class interval with the highest frequency.
Measures of Dispersion:
Range:
- Subtract the smallest value from the largest value in the dataset.
Variance and Standard Deviation:
- For individual data with frequencies:
- Calculate the mean.
- Find the deviation of each value from the mean.
- Square each deviation.
- Multiply each squared deviation by its frequency.
- Sum up these products.
- Divide the total by the sum of frequencies minus one (for sample variance).
- Take the square root of the variance to find the standard deviation.
- For grouped data, use formulas specific to variance and standard deviation for grouped data.
- For individual data with frequencies:
These calculations might differ slightly depending on whether the data is individual or grouped and the specific statistical measure being computed. Always ensure you're using the appropriate formulas for the given context of the frequency table.
What methodologies are employed to derive statistical measures from a frequency table?
Frequency tables provide valuable information about the distribution of data. Several methodologies can be employed to derive statistical measures from them, enabling analysis and interpretation of the data:
1. Measures of Central Tendency:
- Mean (average): Calculated by summing all values and dividing by the total number of values.
- Median: Middle value when the data is arranged in ascending or descending order.
- Mode: Most frequent value in the data set.
2. Measures of Dispersion:
- Range: Difference between the largest and smallest values.
- Variance: Average squared deviations from the mean.
- Standard deviation: Square root of the variance.
- Interquartile range (IQR): Difference between the third and first quartiles.
3. Measures of Relative Position:
- Percentiles: Values that divide the data into 100 equal parts.
- Quartiles: Three values that divide the data into four equal parts (Q1, Q2, Q3).
4. Measures of Association:
- Correlation coefficient (r): Measures the linear relationship between two variables.
- Covariance: Measures the tendency of two variables to move together.
Methodology steps:
- Identify the relevant statistic: Choose the appropriate statistic based on your research question and the type of data.
- Locate the necessary data: Identify the specific columns or rows in the frequency table containing the relevant data points.
- Apply the formula: Calculate the chosen statistic using the appropriate formula and the corresponding data points from the frequency table.
- Interpret the results: Analyze the calculated statistic in the context of your research question and draw meaningful conclusions about the data.
Additional methods:
- Chi-square test: Used to assess the relationship between categorical variables.
- Analysis of variance (ANOVA): Used to compare the means of two or more groups.
- Regression analysis: Used to model the relationship between a dependent variable and one or more independent variables.
Tips:
- Consider using technology tools like spreadsheets or statistical software for efficient calculations and analysis.
- Ensure you understand the assumptions and limitations of each statistic before applying it to your data.
- Report statistical measures with appropriate units and levels of precision.
- Clearly communicate the meaning and implications of the derived measures in your research findings.
By understanding and applying these methodologies, you can effectively utilize frequency tables to gain valuable insights from your data and draw meaningful conclusions.