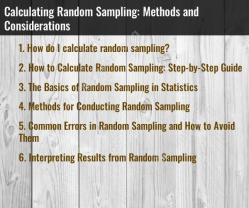
How to calculate confidence intervals?
Calculating confidence intervals involves using statistical methods to estimate a range within which a population parameter is likely to fall. The most common type of confidence interval is for the mean of a population, but confidence intervals can also be calculated for proportions, variances, and other parameters. Here's a step-by-step guide for calculating a confidence interval for the mean of a population:
Step 1: Gather Data
Collect a sample of data from the population of interest. Ensure that the sample is representative and unbiased.
Step 2: Choose the Confidence Level
Decide on the desired confidence level, typically expressed as a percentage. Common choices are 90%, 95%, and 99%. A 95% confidence level is often used, meaning that we are 95% confident that the true parameter falls within the calculated interval.
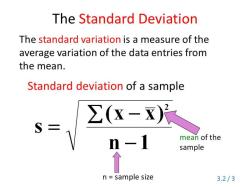
Step 3: Determine the Standard Deviation or Standard Error
If the population standard deviation (σ) is known, you can use it directly. If not, calculate the sample standard deviation (s). The standard error (SE) is then calculated as , where is the sample size.
Step 4: Find the Critical Value
Determine the critical value from the standard normal distribution (Z-distribution) or Student's t-distribution based on the sample size and chosen confidence level. The critical value corresponds to the level of significance (α), which is 1 minus the confidence level. You can find these values in statistical tables or use software/tools.
For a Z-distribution:
For a t-distribution:where df is the degrees of freedom, which is for a sample.
Step 5: Calculate the Margin of Error
Multiply the standard deviation (or standard error) by the critical value to obtain the margin of error (ME):
Step 6: Calculate the Confidence Interval
The confidence interval is then calculated as follows:
Step 7: Interpret the Results
Express the confidence interval in the context of your study. For example, "We are 95% confident that the true population mean lies between X and Y."
Example:
Let's say you have a sample mean () of 50, a sample standard deviation () of 10, and a sample size () of 30. You want to calculate a 95% confidence interval.
- Find the critical value (Z) for a 95% confidence interval.
- Calculate the standard error ().
- Determine the margin of error ().
- Calculate the confidence interval ().
This is a simplified example, and in practice, you might use statistical software or calculators to streamline the process.
Methods for computing confidence intervals
Confidence intervals are a statistical method used to estimate the range of values within which a population parameter is likely to lie. They are calculated based on sample data and provide a level of confidence that the true parameter value falls within the specified interval.
There are several different methods for computing confidence intervals, each with its own strengths and weaknesses. The most appropriate method to use will depend on the specific data being analyzed and the desired level of confidence.
Common Methods for Computing Confidence Intervals
Normal Distribution Method: This method is based on the assumption that the population data follows a normal distribution. It uses the sample mean and standard deviation to calculate the confidence interval. This method is widely used because it is simple to apply and provides accurate results for normally distributed data.
t-Distribution Method: This method is used when the sample size is small or when the population standard deviation is unknown. It uses the sample mean, standard deviation, and degrees of freedom to calculate the confidence interval. The t-distribution is similar to the normal distribution, but it has heavier tails, which means it is more robust to outliers.
Bootstrapping Method: This method is a non-parametric method, which means it does not rely on any assumptions about the distribution of the data. It resamples the data with replacement to create multiple bootstrap samples. The confidence interval is then calculated based on the distribution of the statistic of interest across the bootstrap samples. Bootstrapping is a powerful method that can be used with a wide variety of data types.
Bayes' Theorem Method: This method uses Bayes' theorem to update the probability distribution of a parameter based on new data. It can be used to calculate confidence intervals for both parametric and non-parametric data. Bayes' theorem is a powerful tool for statistical inference, but it can be computationally intensive.
Choosing the Right Method
The best method for computing a confidence interval will depend on the specific situation. Here are some factors to consider:
Sample size: If the sample size is small, then the t-distribution method or bootstrapping method may be more appropriate.
Population distribution: If the population distribution is known to be normal, then the normal distribution method can be used. If the distribution is unknown, then the t-distribution method or bootstrapping method may be more appropriate.
Level of confidence: The level of confidence is the percentage of the time that the true parameter value is expected to fall within the confidence interval. A higher level of confidence will result in a wider confidence interval.
Additional Considerations
In addition to the methods listed above, there are several other methods for computing confidence intervals. The choice of method will depend on the specific data being analyzed and the desired level of confidence.
It is also important to note that confidence intervals are not the same as hypothesis tests. Hypothesis tests are used to determine whether there is a statistically significant difference between two populations, while confidence intervals are used to estimate the range of values within which a population parameter is likely to lie.
I hope this helps!