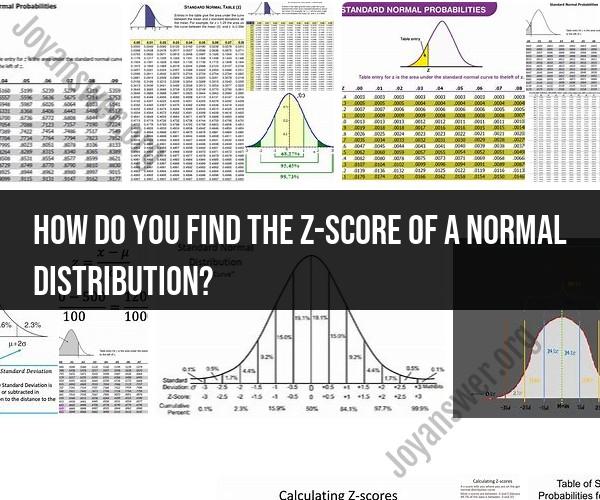
How do you find the z-score of a normal distribution?
To find the z-score (also known as the standard score) of a data point in a normal distribution, you can use the following formula:
z = (X - μ) / σ
Where:
- z is the z-score.
- X is the value you want to standardize.
- μ (mu) is the mean (average) of the distribution.
- σ (sigma) is the standard deviation of the distribution.
Here's a step-by-step guide on how to calculate the z-score of a data point in a normal distribution:
Determine the Mean and Standard Deviation:
- Find or calculate the mean (μ) and standard deviation (σ) of the normal distribution that your data point belongs to. These parameters describe the characteristics of the distribution.
Identify the Data Point (X):
- Identify the specific value (X) for which you want to calculate the z-score. This value should be within the same distribution for which you have the mean and standard deviation.
Apply the Formula:
- Plug the values you've collected into the formula:z = (X - μ) / σ
Calculate the Z-Score:
- Subtract the mean (μ) from the value (X) you want to standardize.
- Divide the result by the standard deviation (σ).
Interpret the Z-Score:
- The resulting z-score indicates how many standard deviations the data point (X) is away from the mean (μ).
- If the z-score is positive, it means the data point is above the mean.
- If the z-score is negative, it means the data point is below the mean.
- If the z-score is zero, it means the data point is at the mean.
Use Z-Scores for Analysis:
- Z-scores are often used for various statistical analyses, such as hypothesis testing, comparing data from different distributions, and identifying outliers.
The z-score standardizes data in a way that allows you to compare and analyze data points across different normal distributions or within the same distribution. It provides a measure of how far a data point deviates from the average in terms of standard deviations.