What is restricted cubic spline in regression analysis?
A restricted cubic spline (RCS) is a mathematical function used in regression analysis to model the relationship between a dependent variable and one or more independent variables. It is a flexible and non-linear method that allows for capturing complex patterns in the data without assuming a specific functional form.
Here's a breakdown of key concepts related to restricted cubic splines in regression analysis:
Cubic Spline: A cubic spline is a piecewise-defined cubic polynomial function that is smooth at the points where the pieces connect. It consists of cubic polynomials defined over consecutive intervals, and the polynomials are connected in a way that ensures continuity of the function and its first and second derivatives.
Restricted Cubic Spline: The term "restricted" refers to the imposition of constraints at the boundary points of the spline. These constraints often involve restricting the behavior of the spline beyond the boundary knots. The most common form of restriction is to require linearity in the tails, meaning that the spline behaves like a linear function as it extends beyond the extreme data points.
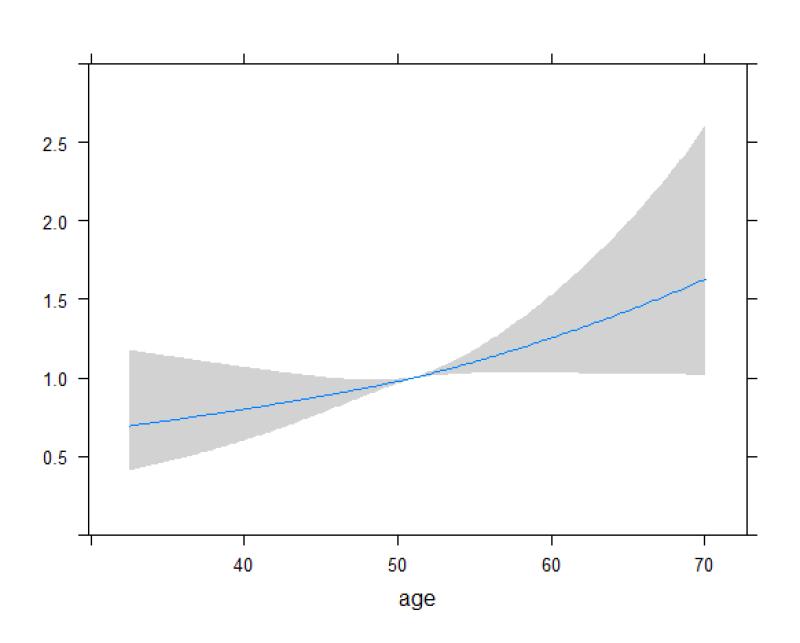
Knots: Knots are the points where the cubic polynomials are connected. The number and placement of knots are crucial in capturing the underlying patterns in the data. Too few knots may result in oversimplification, while too many may lead to overfitting. Researchers often choose knots based on statistical criteria or prior knowledge of the data.
Flexibility: The use of restricted cubic splines provides flexibility in modeling the relationship between the dependent and independent variables. Instead of assuming a linear relationship, a restricted cubic spline allows the data to dictate the shape of the relationship.
Advantages: Restricted cubic splines are particularly useful when the true relationship between variables is unknown or complex. They allow for capturing non-linear patterns, adapting to the data without assuming a specific functional form, and avoiding the pitfalls of overfitting associated with high-degree polynomial regression.
Implementation: In statistical software like R or Python (using libraries like
statsmodelsorscikit-learn), you can include restricted cubic splines in regression models to estimate the coefficients associated with each spline term. The number and placement of knots are typically specified as part of the model.
In summary, restricted cubic splines are a powerful tool in regression analysis, offering flexibility in modeling complex relationships. They are particularly valuable when the relationship between variables is not well-understood and when flexibility in capturing non-linear patterns is required.
Sure, here is a comprehensive overview of restricted cubic splines and their applications in regression analysis:
Introduction to restricted cubic splines and their role in regression analysis
Restricted cubic splines (RCS) are a powerful tool for modeling nonlinear relationships between variables in regression analysis. They provide a flexible and adaptable approach to capturing complex data patterns that may not be adequately represented by traditional linear models.
In regression analysis, restricted cubic splines are used to transform a continuous independent variable into a set of piecewise polynomial functions, known as basis functions. These basis functions allow the model to capture non-linear trends and curvature in the data without sacrificing smoothness or continuity.
The use of restricted cubic splines in regression analysis offers several advantages:
Flexibility: RCS can effectively model a wide range of nonlinear relationships, including curves with varying degrees of curvature and multiple turning points.
Smoothness: RCS provide smooth and continuous curves, ensuring that the fitted model does not exhibit abrupt jumps or discontinuities in the predicted values.
Local control: RCS allow for local control of the fitted curve, enabling the model to capture subtle changes in the relationship between variables within specific regions of the data.
Defining restricted cubic splines and their properties
A restricted cubic spline is a piecewise cubic polynomial function that is constrained to have continuous first and second derivatives at a set of specified points, called knots. This ensures that the fitted curve is smooth and continuous throughout the entire range of the independent variable.
The knots play a crucial role in determining the shape of the fitted curve. Placing knots at strategic locations along the data distribution allows the model to capture local variations in the relationship between variables.
Restricted cubic splines possess several desirable properties:
Piecewise linearity: The spline is linear within each interval between knots.
Continuity: The first and second derivatives of the spline are continuous at the knots.
Local control: The spline's behavior within each interval is determined by the data points within that interval, allowing for local control over the fitted curve.
Fitting restricted cubic splines to data using penalized least squares
Fitting restricted cubic splines to data typically involves a penalized least squares approach. The goal is to minimize the sum of squared residuals (SSR) while penalizing the roughness of the spline.
The roughness penalty is often based on the integrated squared second derivative of the spline. This penalty encourages the spline to be smooth and continuous, preventing it from overfitting the data and exhibiting excessive wiggles.
The choice of the penalty parameter determines the trade-off between smoothness and fit. A larger penalty parameter yields a smoother curve with more flexibility, while a smaller penalty parameter results in a more wiggly curve that may better capture local variations in the data.
Advantages and disadvantages of using restricted cubic splines in regression
Advantages:
Flexibility: RCS can effectively model a wide range of nonlinear relationships.
Smoothness: RCS provide smooth and continuous curves.
Local control: RCS allow for local control of the fitted curve.
Disadvantages:
Choice of knots: The selection of knots can be subjective and may influence the shape of the fitted curve.
Computational complexity: Fitting RCS can be computationally intensive compared to linear regression.
Interpretation: Interpreting the coefficients of RCS can be challenging due to the piecewise nature of the splines.
5. Applications of Restricted Cubic Splines in Various Fields
Restricted cubic splines have found widespread applications in various fields, including:
Finance: Modeling asset price movements, predicting economic indicators, analyzing risk factors.
Engineering: Predicting structural responses, optimizing design parameters, modeling complex physical phenomena.
Medicine: Modeling disease progression, analyzing clinical trial data, assessing treatment efficacy.
Environmental Science: Modeling pollutant concentrations, analyzing climate change trends, predicting environmental impacts.
Social Sciences: Modeling social phenomena, analyzing demographic trends, predicting behavioral patterns.
Restricted cubic splines continue to be an active area of research, with new developments and applications emerging in various disciplines.