How to US SPSS for multiple linear regression?
Performing a multiple linear regression analysis in SPSS involves several steps. Below is a step-by-step guide on how to conduct this analysis using SPSS:
Step 1: Launch SPSS and Load Your Dataset:
- Open SPSS and load the dataset that contains the variables you want to use in the multiple linear regression analysis.
Step 2: Choose the "Regression" Analysis:
- Go to the "Analyze" menu at the top of the SPSS window.
- Select "Regression" and then choose "Linear."
Step 3: Select Your Dependent and Independent Variables:
- In the Linear Regression dialog box, move the dependent variable (the variable you want to predict) from the list on the left to the "Dependent" box on the right.
- Move the independent variables (predictor variables) from the list on the left to the "Independent(s)" box on the right. You can add multiple independent variables by selecting them one by one or by using the "Add All" button.
Step 4: Check Regression Statistics (Optional):
- If you want to obtain additional statistics like R-squared, coefficients, and significance values, click the "Statistics" button in the Linear Regression dialog box. Check the boxes for the statistics you want to include.
Step 5: Examine Collinearity (Optional):
- If you suspect multicollinearity (high correlation among independent variables), you can check for it by clicking the "Collinearity Statistics" button in the Linear Regression dialog box. Select the options you want and click "Continue."
Step 6: Specify Additional Options (Optional):
- In the Linear Regression dialog box, you can specify other options like saving standardized residuals, predicted values, and influence statistics if needed. Use the "Save" and "Plots" buttons for these options.
Step 7: Run the Analysis:
- Once you have specified your dependent and independent variables and any optional settings, click the "OK" button to run the multiple linear regression analysis.
Step 8: Interpret the Results:
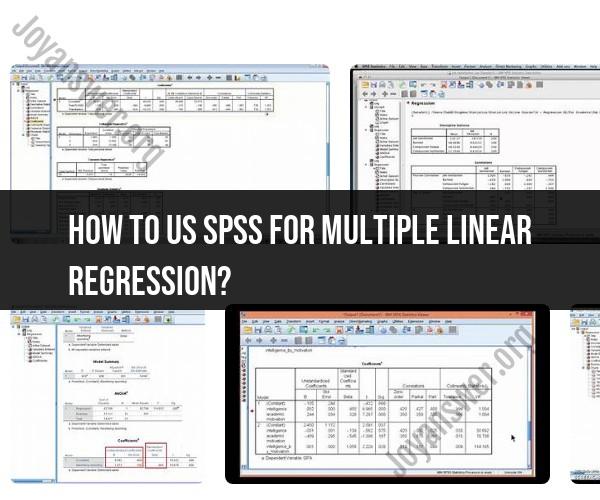
- SPSS will generate output that includes various tables with information about the regression analysis. Key elements to look for include:
- The R-squared value, which represents the proportion of variance explained by the model.
- Coefficients for each independent variable, indicating the strength and direction of their relationship with the dependent variable.
- P-values, which indicate the significance of each independent variable's contribution.
- Residual plots and diagnostic statistics for checking model assumptions.
Step 9: Report Your Findings:
- Write up your results, including the regression equation, coefficients, and their interpretation in the context of your research question. Be sure to mention the R-squared value and the significance of the overall model.
Remember that interpreting the results of a multiple linear regression analysis requires a good understanding of statistical concepts. If you are not confident in your statistical skills, consider consulting with a statistician or data analyst for assistance in interpreting and reporting your findings accurately.
Utilizing SPSS for Multiple Linear Regression Analysis
Multiple linear regression is a statistical technique used to predict a continuous outcome variable based on two or more predictor variables. It is a powerful tool for understanding the relationships between variables and for making predictions.
SPSS is a popular statistical software package that can be used to perform multiple linear regression analysis. It is easy to use and provides a variety of features for data analysis and visualization.
To perform multiple linear regression analysis in SPSS, follow these steps:
- Open SPSS and load your data set.
- Click on Analyze > Regression > Linear.
- In the Linear Regression dialog box, select the Dependent: variable and the Independent: variables.
- Click on OK to run the analysis.
SPSS will produce a variety of output tables, including a table of coefficients, a table of ANOVA, and a table of model summary. The table of coefficients shows the relationship between each predictor variable and the outcome variable. The table of ANOVA shows whether the model is statistically significant and whether the individual predictor variables are significant. The table of model summary shows the overall fit of the model to the data.
Analyzing Data Relationships: Multiple Linear Regression with SPSS
Multiple linear regression analysis can be used to analyze a variety of data relationships. For example, multiple linear regression can be used to:
- Predict student test scores based on their study habits and prior grades.
- Predict employee sales performance based on their years of experience and training.
- Predict patient recovery time based on their age, gender, and severity of injury.
Multiple linear regression analysis is a powerful tool for understanding the relationships between variables and for making predictions. It is a valuable tool for researchers, scientists, and practitioners in a variety of fields.
A Statistical Approach: Using SPSS for Multiple Regression
Multiple linear regression analysis is a statistical technique, and it is important to understand the underlying statistical principles before using it. SPSS provides a variety of resources to help users understand multiple linear regression analysis, including online tutorials, help documentation, and statistical textbooks.
It is also important to note that SPSS is just one of many statistical software packages that can be used to perform multiple linear regression analysis. Other popular statistical software packages include R, Stata, and SAS.
Overall, multiple linear regression analysis is a powerful tool for understanding the relationships between variables and for making predictions. SPSS is a popular statistical software package that can be used to perform multiple linear regression analysis. It is easy to use and provides a variety of features for data analysis and visualization.