Should I use weighted average?
Whether to use a weighted average in data analysis depends on the nature of your data and the specific question or problem you are trying to address. Here are some considerations to help you determine whether a weighted average is appropriate for your analysis:
Heterogeneous Data:
- Use a weighted average when dealing with heterogeneous data, where different elements in the dataset contribute differently to the overall metric. If some data points are more significant or representative than others, a weighted average can provide a more accurate measure.
Varying Importance:
- If certain observations or categories are more important or have more influence on the overall result, a weighted average is appropriate. This is common when dealing with diverse data points that contribute differently to the overall picture.
Unequal Sample Sizes:
- When working with groups or categories with unequal sample sizes, a weighted average can help account for the variations in the size of each group. This is important to prevent small groups from having a disproportionate impact on the overall average.
Meaningful Representation:
- If some data points are more representative of the population or scenario you are studying, assigning them higher weights in the calculation of the average can provide a more meaningful representation.
Skewed Distributions:
- In cases where the distribution of data is skewed, with a few extreme values having a significant impact, a weighted average may be more appropriate than a simple arithmetic mean.
Survey Responses:
- When analyzing survey data, responses from certain demographics or groups may be more relevant to the research question. Assigning weights based on the demographics can help reflect the importance of each subgroup.
Financial Analysis:
- In financial analysis, weighted averages are often used in calculations like the weighted average cost of capital (WACC) or the weighted average interest rate on a portfolio of loans.
Time Series Data:
- In time series analysis, recent data points may be more relevant than older ones. Assigning higher weights to recent observations can help capture current trends.
Adjusting for Bias:
- If certain segments of your data are known to be biased or underrepresented, using weighted averages can help correct for these biases and provide a more accurate overall measure.
However, there are situations where a simple arithmetic mean might be more appropriate, especially if all data points are considered equally important. It's important to understand the characteristics of your data and the goals of your analysis to make an informed decision about whether to use a weighted average or not.
When is using a weighted average beneficial?
A weighted average is beneficial when the values in a data set have different importance or significance. Assigning weights to each value allows you to calculate an average that more accurately reflects the overall value of the data set.
Here are some examples of when using a weighted average is beneficial:
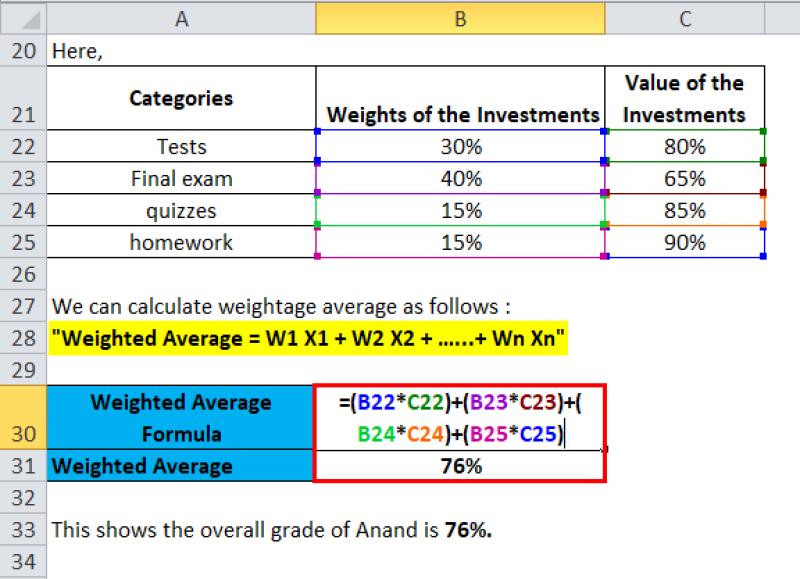
Calculating the average grade in a class: If some assignments are worth more points than others, you can use a weighted average to calculate the overall average grade.
Calculating the average cost of a product: If you purchase the same product from different vendors at different prices, you can use a weighted average to calculate the average cost per unit.
Calculating the average return on investment (ROI): If you invest in multiple assets with different returns, you can use a weighted average to calculate the overall ROI.
How does a weighted average differ from a regular average?
A regular average, also known as an arithmetic mean, is simply the sum of all the values in a data set divided by the number of values. A weighted average, on the other hand, assigns weights to each value before calculating the average. This allows you to give more importance to certain values in the data set.
For example, consider the following data set:
{2, 4, 6}
The regular average of this data set is 4. However, if we assign a weight of 2 to the first value, a weight of 3 to the second value, and a weight of 1 to the third value, the weighted average would be:
((2 * 2) + (4 * 3) + (6 * 1)) / (2 + 3 + 1) = 4.67
As you can see, the weighted average gives more weight to the values that are more important or significant.
What are the applications of weighted averages in finance?
Weighted averages are used in a variety of applications in finance, including:
Calculating the average cost of capital (WACC): The WACC is a weighted average of the costs of different types of capital, such as debt and equity.
Calculating the average return on investment (ROI): The ROI is a weighted average of the returns on different investments.
Calculating the average price-to-earnings ratio (P/E ratio): The P/E ratio is a weighted average of the P/E ratios of different companies.
Calculating the average beta: Beta is a measure of a stock's volatility relative to the market as a whole. The average beta is a weighted average of the betas of different stocks.
How do you calculate a weighted average for complex data sets?
The formula for calculating a weighted average is:
Weighted average = (sum of (weight * value)) / (sum of weights)
Where:
- weight is the weight assigned to a particular value
- value is the value of a particular item
For complex data sets, you may need to use a spreadsheet or a programming language to calculate the weighted average.
Here is an example of how to calculate a weighted average in Excel:
=SUMPRODUCT(A2:A4,B2:B4)/SUM(B2:B4)
In this example, the weighted average is calculated by multiplying each value in column A by its corresponding weight in column B, and then summing the products and dividing by the sum of the weights.
Are there situations where a weighted average should not be used?
A weighted average should not be used if the weights are not assigned correctly. If the weights do not accurately reflect the relative importance of the values in the data set, the weighted average will not be accurate.
Additionally, a weighted average should not be used if there are outliers in the data set. Outliers are values that are significantly different from the rest of the data set. If a data set contains outliers, the weighted average will be distorted by them.
In general, you should only use a weighted average if you are confident that the weights are assigned correctly and that there are no outliers in the data set.