How to evaluate a logistic regression model?
Evaluating a logistic regression model is crucial to assess its performance and determine whether it can effectively make predictions. Here's a comprehensive guide on how to evaluate a logistic regression model:
Data Splitting:
- Divide your dataset into two parts: a training set and a testing (or validation) set. A common split is 70-80% for training and 20-30% for testing.
Model Training:
- Train your logistic regression model on the training dataset using the independent variables (features) to predict the dependent variable (target or outcome).
Model Fitting:
- The logistic regression model estimates coefficients for each feature, which influence the predicted probability of the outcome. These coefficients represent the log-odds or logit values.
Model Prediction:
- Use the trained model to make predictions on the testing dataset. The output of logistic regression is usually in the form of probabilities between 0 and 1.
Threshold Selection:
- Choose a threshold probability (often 0.5) to classify the predictions into binary outcomes (e.g., 0 or 1). Adjusting the threshold can affect the trade-off between precision and recall.
Confusion Matrix:
- Create a confusion matrix to summarize the model's performance:
- True Positive (TP): Correctly predicted positive cases.
- True Negative (TN): Correctly predicted negative cases.
- False Positive (FP): Incorrectly predicted positive cases (Type I error).
- False Negative (FN): Incorrectly predicted negative cases (Type II error).
- Create a confusion matrix to summarize the model's performance:
Performance Metrics:
- Calculate various performance metrics based on the confusion matrix:
- Accuracy = (TP + TN) / (TP + TN + FP + FN)
- Precision = TP / (TP + FP)
- Recall (Sensitivity or True Positive Rate) = TP / (TP + FN)
- Specificity (True Negative Rate) = TN / (TN + FP)
- F1-Score = 2 * (Precision * Recall) / (Precision + Recall)
- Calculate various performance metrics based on the confusion matrix:
ROC Curve (Receiver Operating Characteristic):
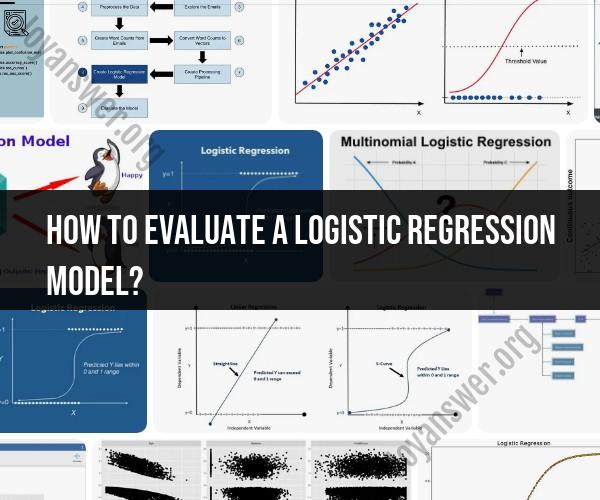
- Plot the ROC curve, which illustrates the model's trade-off between sensitivity (True Positive Rate) and specificity (True Negative Rate) across different threshold values. The area under the ROC curve (AUC-ROC) is a common metric for model performance.
Precision-Recall Curve:
- Plot the precision-recall curve to assess the trade-off between precision and recall at different threshold values. Calculate the area under the precision-recall curve (AUC-PR) to evaluate the model's performance.
Cross-Validation:
- Perform k-fold cross-validation (e.g., 5-fold or 10-fold) to assess the model's generalization ability. This involves splitting the data into multiple subsets, training on some and testing on others, and repeating this process k times.
Model Comparison:
- Compare your logistic regression model's performance to other relevant models (e.g., decision trees, random forests, support vector machines) to determine which one performs better for your specific problem.
Business Context:
- Consider the practical implications of your model's performance in the context of your specific problem. What are the consequences of false positives and false negatives? How will the model be used in real-world scenarios?
Iterate and Refine:
- If your model's performance is not satisfactory, consider feature engineering, hyperparameter tuning, or trying different algorithms to improve its accuracy.
Deployment and Monitoring:
- If your model meets the desired performance criteria, deploy it in a production environment. Continuously monitor its performance and retrain it periodically with new data to maintain its accuracy.
Evaluating a logistic regression model is an iterative process that involves a combination of statistical analysis, visualization, and domain knowledge. It's important to choose the evaluation metrics that are most relevant to your specific problem and objectives.
Mastering Logistic Regression Model Evaluation: Key Techniques and Metrics
Logistic regression is a powerful machine learning algorithm used to predict binary outcomes. However, it is important to evaluate the performance of a logistic regression model before using it to make predictions on real-world data.
There are a number of key techniques and metrics that can be used to evaluate logistic regression models. Some of the most common techniques include:
- Confusion matrix: A confusion matrix is a table that shows the number of correct and incorrect predictions made by a model. The confusion matrix can be used to calculate a number of metrics, such as accuracy, precision, recall, and F1 score.
- ROC curve: An ROC curve (receiver operating characteristic curve) is a graph that shows the trade-off between sensitivity and specificity for a model. The ROC curve can be used to calculate the AUC (area under the curve), which is a measure of the overall performance of a model.
- Cross-validation: Cross-validation is a technique that is used to evaluate the performance of a model on unseen data. In cross-validation, the data is split into multiple folds, and the model is trained and tested on each fold. The average performance of the model on the folds is used as an estimate of the model's performance on unseen data.
Assessing Model Performance: A Comprehensive Guide to Evaluating Logistic Regression
When evaluating the performance of a logistic regression model, it is important to consider a number of factors, including:
- Accuracy: Accuracy is the percentage of correct predictions made by the model. However, accuracy is not always the best metric to use, especially if the data is imbalanced.
- Precision: Precision is the percentage of positive predictions that are correct. Precision is a good metric to use if it is important to avoid making false positive predictions.
- Recall: Recall is the percentage of actual positive cases that are correctly predicted. Recall is a good metric to use if it is important to avoid making false negative predictions.
- F1 score: The F1 score is a harmonic mean of precision and recall. The F1 score is a good metric to use if it is important to balance precision and recall.
- AUC: The AUC is a measure of the overall performance of a model. An AUC of 1 indicates that the model is perfect, while an AUC of 0.5 indicates that the model is performing no better than random guessing.
Going Beyond Accuracy: Evaluating the Effectiveness of Logistic Regression Models
In addition to the metrics listed above, there are a number of other factors that can be considered when evaluating the effectiveness of logistic regression models. Some of these factors include:
- Interpretability: It is important to be able to interpret the results of a logistic regression model. This means understanding how the model's predictions are affected by the input variables.
- Robustness: It is important to ensure that a logistic regression model is robust to changes in the data. This means that the model should not be overly sensitive to outliers or noise in the data.
- Scalability: It is important to ensure that a logistic regression model can be scaled to handle large datasets. This is especially important if the model is going to be used to make predictions on real-world data.
By considering all of these factors, you can develop a comprehensive evaluation of your logistic regression model. This will help you to ensure that the model is performing well and that it is appropriate for your specific needs.
