How to calculate the adjusted coefficient of determination?
The adjusted coefficient of determination, often denoted as R-squared (R²) adj, is a modified version of the regular R-squared that takes into account the number of independent variables in a regression model. It is a measure of how well the independent variables explain the variability in the dependent variable while penalizing the inclusion of unnecessary variables. Here's a step-by-step guide to calculate the adjusted R-squared:
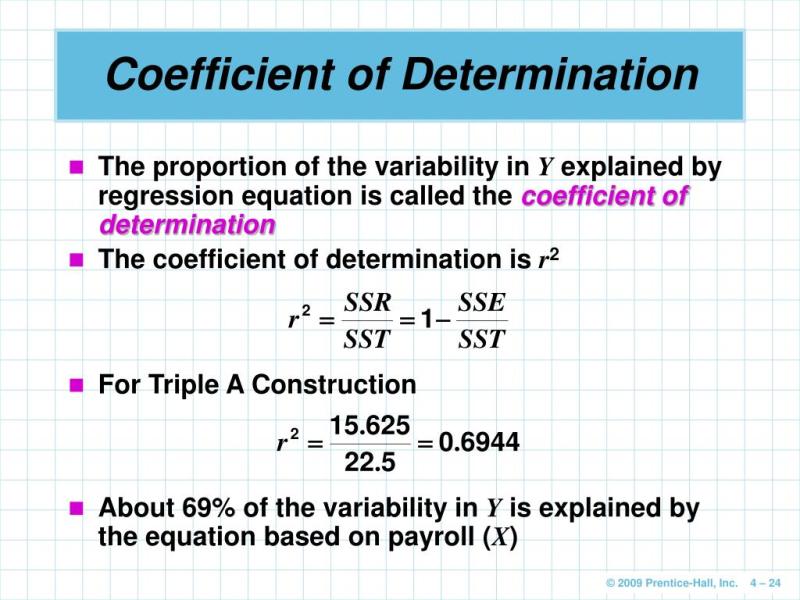
Calculate the Regular R-squared (R²): Before calculating the adjusted R-squared, you need to calculate the regular R-squared using the following formula:
R² = 1 - (SSR / SST)
- SSR (Sum of Squares Residual) is the sum of the squared differences between the actual and predicted values of the dependent variable.
- SST (Total Sum of Squares) is the sum of the squared differences between the actual values of the dependent variable and its mean.
Determine the Number of Independent Variables (k): Count the number of independent variables in your regression model. These are the variables used to predict the dependent variable.
Determine the Total Number of Data Points (n): Count the total number of data points or observations in your dataset.
Calculate the Adjusted R-squared (R² adj): Use the following formula to calculate the adjusted R-squared:
R² adj = 1 - [(1 - R²) * (n - 1) / (n - k - 1)]
- R² is the regular coefficient of determination you calculated in step 1.
- n is the total number of data points.
- k is the number of independent variables in your regression model.
The adjusted R-squared penalizes the model for including unnecessary independent variables. It increases as more relevant independent variables are added to the model but decreases when irrelevant variables are added.
The adjusted R-squared provides a more accurate assessment of a regression model's goodness of fit, especially when comparing models with different numbers of independent variables. It helps you strike a balance between maximizing the model's explanatory power and avoiding overfitting.
In summary, the adjusted R-squared is a valuable statistic for assessing the quality of a regression model while accounting for the number of independent variables included in the model.
Calculating the Adjusted Coefficient of Determination: Methods and Significance
The adjusted coefficient of determination, denoted by R², is a modified version of the coefficient of determination (R²) that penalizes the model for the addition of more independent variables. This adjustment is particularly important when dealing with multiple independent variables, as adding more variables can artificially inflate the R² value, even if the additional variables don't provide any meaningful explanatory power.
Methods for Calculating Adjusted R²
There are two primary methods for calculating adjusted R²:
- Formula Method: The adjusted R² can be calculated using the following formula:
Adjusted R² = 1 - ((1 - R²) * (n - 1) / (df_error))
where:
- R² is the original coefficient of determination
- n is the sample size
- df_error is the degrees of freedom for error
- Statistical Software: Most statistical software packages, such as R, SAS, and SPSS, have built-in functions for calculating adjusted R².
Significance of Adjusted R²
The adjusted R² is more conservative than the original R² and is generally preferred when evaluating the performance of regression models with multiple independent variables. It provides a more accurate indication of how well the model explains the dependent variable while accounting for the number of independent variables.
Enhancing Regression Models with the Adjusted R-squared
The adjusted R² can be used to identify overfitting in a regression model. Overfitting occurs when the model becomes too complex and starts to fit the noise in the data rather than the underlying relationship between the variables. This can lead to poor predictive performance on new data.
By comparing the adjusted R² to the original R², one can assess whether the addition of more independent variables is improving the model's ability to explain the data or simply overfitting the noise. If the adjusted R² increases significantly while the original R² increases only slightly, it suggests that the additional variables may not be adding meaningful explanatory power.
Statistical Adjustments and the Coefficient of Determination
Statistical adjustments to the coefficient of determination are crucial for addressing potential issues with the original R² metric. These adjustments help to ensure that the R² value accurately reflects the true explanatory power of the model and prevents overestimation due to the addition of irrelevant independent variables.
The adjusted R² provides a more reliable measure of the model's goodness of fit and can be used to make informed decisions about model selection and variable inclusion. By considering the adjusted R², researchers can develop more robust and predictive regression models.