How do you find the coefficient of determination?
The coefficient of determination, often denoted as R-squared (R²), measures the proportion of the variance in the dependent variable that is predictable from the independent variables in a regression analysis. To find the coefficient of determination, you can follow these steps:
Perform a Regression Analysis:
- Before you can calculate R-squared, you need to run a regression analysis. This analysis involves fitting a regression model (linear, multiple, or another type) to your data using statistical software or a spreadsheet program.
Calculate the Total Sum of Squares (SST):
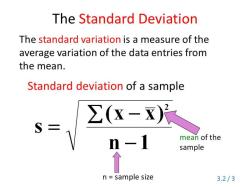
- SST represents the total variability in the dependent variable (Y). To calculate it, find the sum of the squared differences between each observed Y value and the mean of Y. The formula for SST is as follows:
SST = Σ(Yi - Ȳ)²where:
- Yi = each observed value of the dependent variable.
- Ȳ = the mean (average) of the dependent variable.
Calculate the Residual Sum of Squares (SSR):
- SSR represents the unexplained or residual variability in the dependent variable. It measures the squared differences between each observed Y value and the predicted Y value from the regression model. The formula for SSR is as follows:
SSR = Σ(Yi - Ȳi)²where:
- Ȳi = the predicted value of the dependent variable based on the regression model.
Calculate R-squared (R²):
- Use the following formula to calculate R-squared, which represents the proportion of variability in the dependent variable explained by the independent variables:
R² = 1 - (SSR / SST)
Interpret R-squared:
- R-squared values range from 0 to 1.
- R² = 0: This means that none of the variability in the dependent variable is explained by the independent variables in the model. The model does not provide useful information for predicting the dependent variable.
- R² = 1: In this case, the model perfectly predicts the dependent variable's variance, and all data points fall exactly on the regression line. This is rare and can indicate overfitting.
- 0 < R-squared < 1: In practice, R-squared values fall between 0 and 1. The closer R-squared is to 1, the better the model explains the variance in the dependent variable.
It's important to interpret R-squared in the context of your specific analysis and objectives. A high R-squared does not guarantee a good model, and a low R-squared does not necessarily mean a poor model. Other factors, such as the research question, the significance of coefficients, and the model's assumptions, should be considered when assessing the quality of the regression analysis.
Finding the Coefficient of Determination: A Statistical Guide
The coefficient of determination, often denoted by R², is a statistical measure that quantifies the strength of the relationship between a dependent variable (Y) and one or more independent variables (X). It represents the proportion of the variance in the dependent variable that can be predicted from the independent variable(s). In simpler terms, it indicates how well the independent variable(s) explain the changes observed in the dependent variable.
Calculating the Coefficient of Determination in Data Analysis
There are two main approaches to calculating the coefficient of determination:
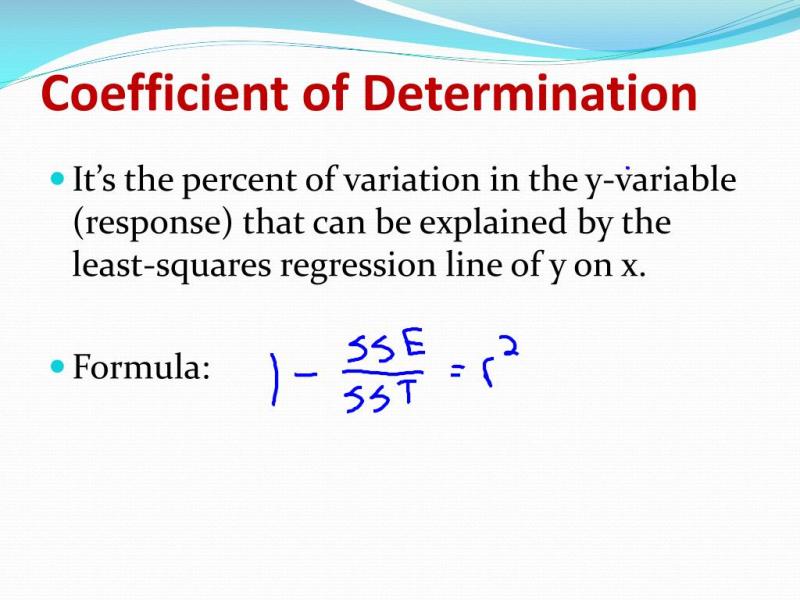
- Formula Method: The direct calculation of R² involves the following formula:
R² = 1 - (SSE / SST)
where:
SSE (Sum of Squared Errors) represents the sum of the squared differences between the predicted values and the actual values of the dependent variable.
SST (Total Sum of Squares) represents the sum of the squared differences between the actual values of the dependent variable and the mean of the dependent variable.
- Statistical Software: Most statistical software packages, such as R, SAS, and SPSS, provide built-in functions for calculating R² directly from the data.
Interpreting Data Relationships with the Coefficient of Determination
The coefficient of determination, R², is interpreted as a value between 0 and 1:
R² = 0: Indicates no correlation between the variables, meaning the independent variable has no predictive power for the dependent variable.
0 < R² < 1: Suggests a positive correlation, implying the independent variable explains some portion of the variation in the dependent variable. A higher R² value indicates a stronger correlation.
R² = 1: Represents a perfect correlation, signifying that the independent variable perfectly explains the variation in the dependent variable.
In general, a higher R² value indicates a stronger relationship between the variables. However, it's important to note that R² alone does not guarantee a causal relationship. Other factors, such as the presence of outliers and the statistical significance of the independent variables, should also be considered when interpreting the results.
Applications of the Coefficient of Determination
The coefficient of determination has wide-ranging applications in various statistical fields, including:
Assessing Model Fit: Evaluating the goodness of fit of regression models by quantifying the proportion of variance explained by the independent variables.
Model Comparison: Comparing the relative performance of different regression models by evaluating their respective R² values, indicating which model better explains the relationship between the variables.
Relationship Strength Assessment: Gauging the strength of the association between variables by interpreting the R² value, providing insights into the explanatory power of the independent variables.
Variable Importance Identification: Identifying the most influential independent variables in a regression model by examining their relative contributions to the overall R² value.
Prediction: Making informed predictions about the dependent variable based on the independent variables, utilizing the regression model and the coefficient of determination.
Understanding and interpreting the coefficient of determination is essential for analyzing and interpreting data relationships in various research and statistical applications.