How do you construct a residual plot?
Constructing a residual plot is an essential step in evaluating the performance of a regression model. A residual plot helps you assess whether your model's predictions are capturing the underlying patterns in the data or if there are systematic errors (residuals) that suggest your model is missing something. Here's a step-by-step guide on how to construct a residual plot:
Step 1: Build Your Regression ModelBefore you can create a residual plot, you need to have a regression model in place. This could be a simple linear regression, multiple regression, or any other type of regression model depending on your data and research question.
Step 2: Calculate ResidualsResiduals are the differences between the actual target values (observed) and the predicted values (estimated) by your regression model. For each data point, calculate the residual using the formula:Residual = Observed Value - Predicted Value
Step 3: Order Your DataTo create a residual plot, it's a good practice to order your data by the independent variable (the predictor variable) that you're using in your regression model. This helps you visualize potential patterns or trends in the residuals.
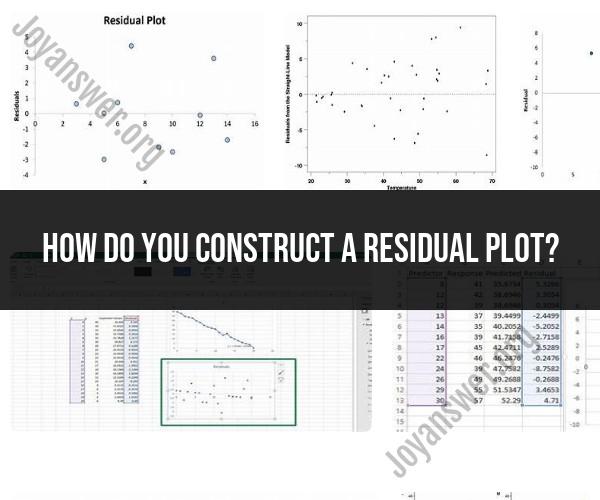
Step 4: Create a ScatterplotNow, plot the ordered independent variable values on the x-axis and the corresponding residuals on the y-axis. This creates a scatterplot where each point represents a data point from your dataset.
Step 5: Analyze the Residual PlotOnce you have your residual plot, you should examine it for patterns or trends. Here are some things to look for:
a. Randomness: Ideally, the residuals should appear randomly scattered around the horizontal line at y = 0. This suggests that your model is making unbiased predictions.
b. Heteroscedasticity: Check for any funnel-like shape in the residual plot. If the spread of residuals varies as the independent variable changes, it indicates heteroscedasticity, which suggests that your model's performance is inconsistent across different levels of the predictor variable.
c. Outliers: Look for any extreme outliers in the residuals. Outliers can indicate data points that are poorly explained by your model.
d. Patterns: If you see any patterns, such as a curve or systematic deviations from the horizontal line, it suggests that your model may not adequately capture the underlying relationship in the data.
Step 6: InterpretationBased on your analysis of the residual plot, you may need to make adjustments to your regression model. This could involve adding new predictor variables, transforming existing variables, or choosing a different type of regression model. The goal is to make the residuals as random and centered around zero as possible.
Step 7: Repeat if NecessaryIf you make changes to your model, it's a good practice to create a new residual plot and repeat the analysis until you are satisfied with the model's performance.
In summary, constructing a residual plot involves calculating the residuals from your regression model and then creating a scatterplot of these residuals against the independent variable. Analyzing the plot can help you identify issues with your model and guide improvements.
Constructing Residual Plots: A Practical Guide for Data Analysis
A residual plot is a graphical representation of the residuals from a fitted statistical model. Residuals are the difference between the observed values of a variable and the predicted values from the model. Residual plots can be used to assess the fit of the model, identify outliers, and detect patterns in the data.
To construct a residual plot, you will need the following:
- The observed values of the variable of interest
- The predicted values from the fitted model
Once you have this information, you can create a residual plot by following these steps:
- Plot the predicted values on the x-axis and the residuals on the y-axis.
- Draw a reference line at y = 0. This line represents the perfect fit of the model.
- Examine the plot for any patterns or outliers.
Visualizing Data Residues: How to Create and Interpret Residual Plots
Residual plots can be used to visualize data residues in a number of ways. The most common type of residual plot is the scatter plot, which shows the relationship between the predicted values and the residuals. Other types of residual plots include:
- Histogram: A histogram shows the distribution of the residuals. This can be useful for identifying outliers and for assessing the normality of the residuals.
- Q-Q plot: A Q-Q plot compares the distribution of the residuals to the distribution of a normal distribution. This can be useful for assessing the normality of the residuals and for identifying outliers.
- Time series plot: A time series plot shows the residuals over time. This can be useful for identifying patterns in the data, such as seasonal trends or autocorrelation.
Data Analysis Tools: The Importance of Residual Plots in Statistics
Residual plots are important tools for data analysis. They can be used to:
- Assess the fit of a statistical model
- Identify outliers
- Detect patterns in the data
- Diagnose problems with the model
Residual plots are easy to construct and interpret, and they can provide valuable insights into the data.
Here are some examples of how residual plots can be used in data analysis:
- A researcher might use a residual plot to assess the fit of a regression model to their data. If the residuals are randomly scattered around the y-axis, then the model is a good fit to the data. However, if the residuals show any patterns, such as a funnel shape or a fan shape, then the model is not a good fit to the data.
- A data scientist might use a residual plot to identify outliers in their data. Outliers are data points that are significantly different from the rest of the data. Outliers can be caused by errors in data collection or by unusual events.
- A financial analyst might use a residual plot to detect patterns in the stock market. For example, they might look for seasonal trends or for autocorrelation in the residuals.
Residual plots are powerful tools for data analysis. They can be used to assess the fit of a statistical model, identify outliers, detect patterns in the data, and diagnose problems with the model.