Home » Statistics » Understanding Z-Score: Significance and Interpretation

Understanding Z-Score: Significance and Interpretation

September 12, 2023 by JoyAnswer.org, Category : Statistics

What is a z score and what does it mean? Explore the concept of the Z-Score and its significance in statistics. Learn how to interpret Z-Scores and their role in standardizing and comparing data values.


Understanding Z-Score: Significance and Interpretation

What is a z score and what does it mean?

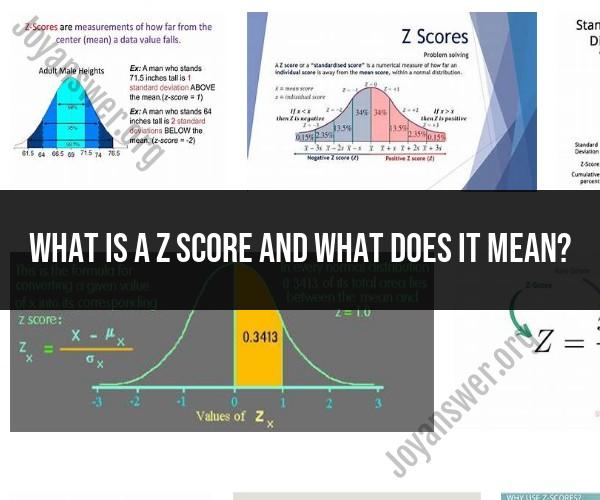
A z-score, also known as a standard score, is a statistical measure that quantifies how far a particular data point is from the mean (average) of a dataset in terms of standard deviations. Z-scores are used to standardize data and make it easier to compare values from different datasets or understand the relative position of a data point within a distribution. Here's what a z-score is and what it means:

  1. Formula for Z-Score:The formula for calculating a z-score for a specific data point xx in a dataset with mean μ\mu and standard deviation σ\sigma is:

    z=xμσz = \frac{x - \mu}{\sigma}

    • zz is the z-score.
    • xx is the individual data point.
    • μ\mu (mu) is the mean of the dataset.
    • σ\sigma (sigma) is the standard deviation of the dataset.
  2. Significance and Interpretation:

    • Magnitude: The magnitude of the z-score indicates how many standard deviations a data point is from the mean. A larger magnitude suggests a greater deviation from the mean.
    • Positive or Negative: The sign of the z-score (positive or negative) indicates whether the data point is above or below the mean:
      • A positive z-score means the data point is above the mean.
      • A negative z-score means the data point is below the mean.
    • Meaning: A z-score tells you how "unusual" or "typical" a data point is within a dataset. It provides context about how far the data point is from the center (mean) and how spread out the data is (standard deviation).
  3. Use Cases:

    • Comparison: Z-scores are used to compare data points from different datasets. By standardizing the values, you can assess how each data point relates to its respective dataset.
    • Outlier Detection: Z-scores can help identify outliers in a dataset. Data points with z-scores significantly higher or lower than zero may be considered outliers.
    • Statistical Testing: Z-scores are often used in hypothesis testing and statistical analysis to determine if a data point is significantly different from the mean.
  4. Example:Let's say you have a dataset of test scores in a class with a mean (μ\mu) of 75 and a standard deviation (σ\sigma) of 10. If a student scored 85 on the test, you can calculate the z-score as follows:

    z=857510=1z = \frac{85 - 75}{10} = 1

    This z-score of 1 indicates that the student's score is 1 standard deviation above the mean. In this context, it means the student performed relatively well compared to the class's average.

In summary, a z-score provides a standardized way to assess the relative position of a data point within a dataset, helping you understand how "typical" or "unusual" that data point is in the context of the dataset's distribution.

Tags Z-Score , Statistical Significance , Data Interpretation

People also ask

  • How to find the mean, median, and standard deviation in Excel?

    Suppose we have multiple datasets in Excel: To calculate the mean and standard deviation of the first dataset, we can use the following two formulas: Mean: =AVERAGE (B2:B21) Standard Deviation: =STDEV.S (B2:B21)
    Unlock the full potential of Microsoft Excel's statistical capabilities as we guide you through the process of calculating mean, median, and standard deviation. Learn step-by-step methods to harness these essential tools for data analysis and gain insights from your datasets. ...Continue reading

  • What is the most important discrete variable?

    The most important discrete variable is the identity of the lending bank. It may come as a surprise to see such a large bank-specific effect, but the difference between the prices of the most aggressive and the most conservative lenders during this period is approximately 200 bp.
    Delve into essential discrete variables and their role in statistical analysis. Explore variables that have significant impact and relevance in various fields, enhancing your ability to interpret and analyze data. ...Continue reading

  • What is the percentile of standard deviation?

    Score Percentile Description Standard Deviation Sight Word Efficiency 83 13 Below Avg. - 1 SD Phonemic Decoding Efficiency 76 6 Poor - 1.5 SD Total Word Reading Efficiency 75 5 Poor - 1.5 SD Title Standard Deviation/Standard Score Correspondence
    Gain a deeper understanding of the concept of the percentile of standard deviation in statistical analysis. Explore its significance in evaluating data distribution, variability, and establishing benchmarks. ...Continue reading

The article link is https://joyanswer.org/understanding-z-score-significance-and-interpretation, and reproduction or copying is strictly prohibited.