Home » Statistics » Unveiling the Ordinary Least Squares Estimator: Statistical Regression Technique

Unveiling the Ordinary Least Squares Estimator: Statistical Regression Technique

August 23, 2023 by JoyAnswer.org, Category : Statistics

What is the ordinary least squares estimator? Explore the fundamental concept of the Ordinary Least Squares (OLS) estimator in statistical regression analysis. Learn how OLS is utilized to estimate the parameters of a linear regression model, enabling data analysts to uncover relationships between variables and make predictions.


Unveiling the Ordinary Least Squares Estimator: Statistical Regression Technique

What is the ordinary least squares estimator?

The Ordinary Least Squares (OLS) estimator is a statistical technique used in regression analysis to estimate the parameters of a linear regression model. It is a method for finding the best-fitting linear relationship between a dependent variable and one or more independent variables. Here's how it works:

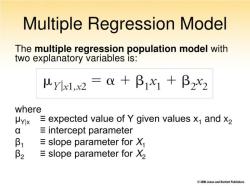
  1. Linear Regression Model: In linear regression, you have a dependent variable (the one you're trying to predict) and one or more independent variables (predictors). The relationship between them is assumed to be linear, meaning you're trying to find a linear equation of the form:

    Y = β₀ + β₁X₁ + β₂X₂ + ... + βₖXₖ + ε

    • Y is the dependent variable.
    • X₁, X₂, ..., Xₖ are the independent variables.
    • β₀, β₁, β₂, ..., βₖ are the parameters you want to estimate.
    • ε represents the error term, which captures the difference between the predicted and actual values.
  2. Objective: The goal of OLS is to find the values of β₀, β₁, β₂, ..., βₖ that minimize the sum of the squared differences between the observed values of the dependent variable and the values predicted by the linear equation.

  3. Minimization: OLS finds the best-fitting line by minimizing the sum of the squared residuals (the ε terms). The residuals are the differences between the observed Y values and the values predicted by the linear equation. Squaring them ensures that both positive and negative differences are considered.

  4. Least Squares Solution: The OLS estimator calculates the values of β₀, β₁, β₂, ..., βₖ that minimize the sum of the squared residuals. These values provide the equation for the linear model that best fits the data.

  5. Interpretation: Once the OLS estimates are obtained, you can interpret the coefficients (β₀, β₁, β₂, ...) to understand how changes in the independent variables are associated with changes in the dependent variable.

OLS is widely used in various fields for tasks such as predictive modeling, hypothesis testing, and understanding relationships between variables. It's important to note that OLS makes certain assumptions about the data, including linearity, independence of errors, and homoscedasticity (constant variance of residuals). Violations of these assumptions can affect the reliability of OLS estimates.

Tags Ordinary Least Squares , Regression Estimation , Statistical Analysis

People also ask

  • What percentage of data falls within 2 standard deviations?

    The second part of the empirical rule states that 95% of the data values will fall within 2 standard deviations of the mean. To calculate "within 2 standard deviations," you need to subtract 2 standard deviations from the mean, then add 2 standard deviations to the mean. That will give you the range for 95% of the data values.
    Understand the significance of data spread within 2 standard deviations of the mean. Learn how to calculate and interpret the percentage of data points that fall within this range in a normal distribution. ...Continue reading

  • How can you identify a discrete variable?

    If there exists a minimum finite distance that must separate any two unique variable values - or, equivalently, the variable may only take on a finite number of different possible values within an arbitrarily-chosen interval -- then the variable is discrete.
    Learn how to identify discrete variables in datasets. Explore the key characteristics that distinguish them from continuous variables and understand techniques for recognizing them in various contexts. ...Continue reading

  • What are discrete and categorical variables?

    Categorical variables contain a finite number of categories or distinct groups. Categorical data might not have a logical order. For example, categorical predictors include gender, material type, and payment method. Discrete variable Discrete variables are numeric variables that have a countable number of values between any two values.
    Clarify the distinctions between discrete and categorical variables in statistics. Learn how these types of variables are defined, used, and analyzed in various data-driven contexts. ...Continue reading

The article link is https://joyanswer.org/unveiling-the-ordinary-least-squares-estimator-statistical-regression-technique, and reproduction or copying is strictly prohibited.