What is a 90 confidence level?
A 90% confidence level is a statistical measure that represents the degree of confidence or certainty that a calculated confidence interval contains the true population parameter. In other words, when you calculate a 90% confidence interval from a sample of data, you can interpret it as follows:
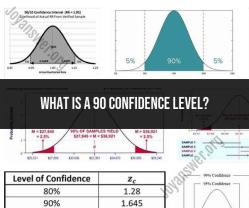
"If we were to take many random samples from the same population and calculate a confidence interval for each sample, we would expect approximately 90% of those intervals to contain the true population parameter."
Here's how a 90% confidence level is typically used in statistics:
Sample Data: You start with a sample of data collected from a population. This sample is often used to estimate a population parameter, such as the population mean, population proportion, or population variance.
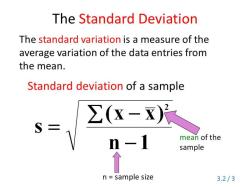
Confidence Interval Calculation: Using statistical methods, you calculate a confidence interval around your sample estimate. The width of the interval depends on factors like the sample size, the level of confidence (in this case, 90%), and the variability in the data.
Interpretation: The resulting confidence interval provides a range of values within which you are reasonably confident the true population parameter lies. In the case of a 90% confidence interval, you are saying that you have 90% confidence that the true parameter falls within the interval.
Probability of Containment: It's important to understand that the 90% confidence level does not mean that there is a 90% probability that the true parameter falls within the specific interval you calculated. Instead, it means that if you were to conduct many similar experiments and calculate 90% confidence intervals for each, approximately 90% of those intervals would contain the true parameter.
Margin of Error: The width of the confidence interval is often referred to as the "margin of error." It represents the range within which you expect the true parameter to be with a given level of confidence. A narrower interval indicates greater precision, while a wider interval reflects less precision.
A 90% confidence level is commonly used in statistical analysis when a moderate level of confidence is acceptable. Researchers and analysts often choose the confidence level based on the specific research question, objectives, and the acceptable level of risk. Higher confidence levels, such as 95% or 99%, provide greater confidence but result in wider confidence intervals, which may be less precise. Lower confidence levels, like 80%, provide narrower intervals but come with a slightly higher risk of not containing the true parameter. The choice of confidence level depends on the trade-off between precision and risk that is appropriate for the analysis.
Understanding a 90% Confidence Level: What It Signifies
A 90% confidence level means that there is a 90% chance that the confidence interval contains the true population parameter. For example, if you calculate a 90% confidence interval for the mean height of adults in the United States, there is a 90% chance that the true mean height is within the confidence interval.
The Significance of a 90% Confidence Level in Statistics
A 90% confidence level is a common confidence level used in statistics. It is a good balance between accuracy and precision. A higher confidence level would result in a wider confidence interval, but it would also be more accurate. A lower confidence level would result in a narrower confidence interval, but it would also be less accurate.
Confidence Levels Demystified: Exploring the 90% Threshold
Confidence levels are used to quantify the uncertainty in a statistical estimate. The higher the confidence level, the less uncertain the estimate is. However, it is important to note that no confidence interval is certain. There is always a chance that the true population parameter is outside of the confidence interval.
The 90% confidence level is a good balance between accuracy and precision. It is often used in statistics because it is a good compromise between these two factors.
Here are some examples of when a 90% confidence level might be used:
- A scientist might use a 90% confidence interval to estimate the mean height of adults in the United States.
- A politician might use a 90% confidence interval to estimate the percentage of voters who support them.
- A business might use a 90% confidence interval to estimate the average revenue generated by a new product.
It is important to note that confidence intervals should be interpreted with caution. They do not guarantee that the true population parameter is within the interval. However, they do provide a useful way to quantify the uncertainty in a statistical estimate.