What is a good confidence interval?
A good confidence interval is one that provides a high level of confidence in the accuracy and precision of the estimate it contains. In statistics, a confidence interval is a range of values that is constructed around a sample statistic (such as a sample mean or proportion) to provide an interval estimate of a population parameter (such as the population mean or proportion). Here are key characteristics that make a confidence interval "good":
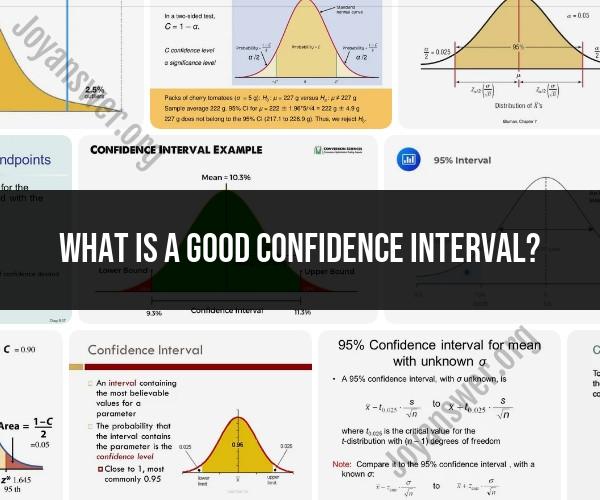
High Confidence Level: The confidence level represents the probability that the true population parameter falls within the interval. A common confidence level is 95%, meaning that if you were to take many samples and compute confidence intervals for each, you would expect about 95% of those intervals to contain the true parameter. A higher confidence level, such as 99%, provides greater confidence but results in wider intervals.
Narrow Width: A good confidence interval should be as narrow as possible while maintaining the desired level of confidence. A narrower interval indicates greater precision in estimating the parameter.
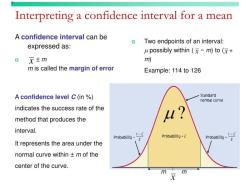
Smaller Margin of Error: The margin of error is the maximum amount by which the estimate is likely to deviate from the true parameter. A good confidence interval has a smaller margin of error, which means the estimate is more accurate.
Large Sample Size: Confidence intervals tend to be narrower and more accurate with larger sample sizes. A good confidence interval is often associated with a sufficiently large sample size to reduce sampling variability.
Minimal Assumptions: A good confidence interval relies on minimal assumptions about the underlying data distribution. Non-parametric methods or methods that are robust to violations of assumptions are preferred when making confidence intervals.
Representative Sample: The sample should be representative of the population of interest. If the sample is biased or not representative, the confidence interval may not accurately reflect the population parameter.
Appropriate Statistical Method: The method used to calculate the confidence interval should be appropriate for the type of data and parameter being estimated. For example, different methods are used for means, proportions, variances, etc.
Independence: The observations in the sample should be independent of each other. Independence is a fundamental assumption for constructing reliable confidence intervals.
Accurate Estimator: The sample statistic used as the point estimate within the confidence interval should be an accurate estimator of the population parameter. For example, the sample mean is an accurate estimator of the population mean under certain conditions.
Real-World Interpretability: A good confidence interval should be interpretable in the context of the problem being studied. It should make sense and provide practical insights.
It's important to note that achieving a narrower confidence interval often comes at the cost of increased complexity or larger sample sizes. The choice of a "good" confidence interval also depends on the specific research question, objectives, and acceptable levels of risk. Researchers must strike a balance between the desired level of confidence and the practical constraints of data collection and analysis.
Crafting a Reliable Confidence Interval: Best Practices
Here are some best practices for crafting a reliable confidence interval:
- Use a large sample size. The larger the sample size, the more accurate and precise the confidence interval will be.
- Choose the right confidence level. The confidence level is the probability that the confidence interval contains the true population parameter. Higher confidence levels will result in wider confidence intervals.
- Use a normal distribution. If the population data is normally distributed, then you can use a normal distribution to calculate the confidence interval. If the population data is not normally distributed, then you may need to use a different method, such as a non-parametric confidence interval.
- Correct for bias. Bias can occur in sampling and measurement. It is important to identify and correct for any bias in your data before calculating the confidence interval.
- Report the confidence interval correctly. When reporting the confidence interval, be sure to include the confidence level and the lower and upper bounds of the interval.
What Makes a Good Confidence Interval? Criteria and Guidelines
A good confidence interval should be:
- Accurate: The confidence interval should be centered around the true population parameter.
- Precise: The confidence interval should be narrow enough to be useful, but not so narrow that it is unrealistic.
- Reliable: The confidence interval should be calculated using a valid statistical method.
- Interpretable: The confidence interval should be reported in a way that is easy to understand and interpret.
Confidence Intervals: How to Ensure Accuracy and Precision
To ensure that your confidence interval is accurate and precise, follow the best practices listed above. Additionally, you can use a statistical software package to calculate the confidence interval for you. Statistical software packages will automatically correct for bias and calculate the confidence interval using a valid statistical method.
Here are some additional tips for ensuring the accuracy and precision of your confidence interval:
- Use a representative sample. The sample should be representative of the population that you are interested in.
- Collect high-quality data. The data should be collected accurately and precisely.
- Check for outliers. Outliers can skew the results of your analysis, so it is important to identify and remove any outliers before calculating the confidence interval.
- Use a reliable statistical method. There are a number of different statistical methods for calculating confidence intervals. Choose a method that is appropriate for your data and your research goals.
By following these best practices and tips, you can create reliable confidence intervals that will help you to interpret your data and make informed decisions.
