How many classes does a frequency distribution have?
Frequency distributions are a fundamental tool in statistics that help us understand the distribution of data and patterns within it. This article takes a closer look at the concept of class structures within frequency distributions, shedding light on how they provide insights into data variability and occurrence.
Introduction to Frequency Distributions
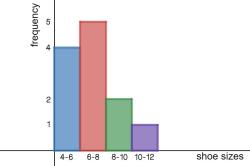
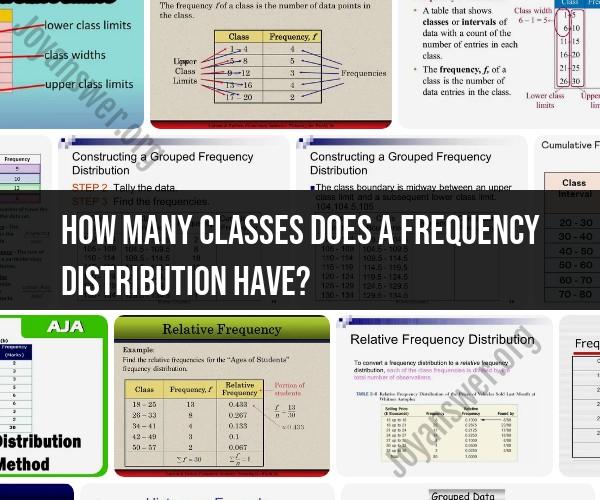
Frequency distributions organize data into distinct categories or classes and count how many observations fall into each category. This enables us to identify trends, central tendencies, and variability within the data.
The Role of Class Structures
Class structures define the intervals or ranges into which data is grouped. They play a crucial role in shaping the granularity and comprehensiveness of the frequency distribution.
1. Choosing Class Intervals
Deciding on the size of class intervals involves striking a balance between capturing data variations and avoiding excessive fragmentation.
2. Class Limits and Boundaries
Each class has limits that define its range, and class boundaries that ensure data points are correctly assigned to the appropriate class.
Constructing Class Structures
1. Identify Data Range
Determine the minimum and maximum values in your dataset to establish the overall data range.
2. Calculate Range
Calculate the range by subtracting the minimum value from the maximum value.
3. Determine the Number of Classes
The square root of the number of data points is a common formula to determine the number of classes, providing a balanced view of data distribution.
4. Calculate Class Width
Divide the range by the number of classes to calculate the class width, ensuring it's an even interval.
5. Define Class Boundaries
Class boundaries are established by adding or subtracting half of the class width from the class limits.
Benefits of Understanding Class Structures
1. Enhanced Data Interpretation
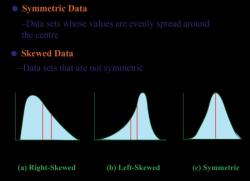
Class structures offer a clearer view of data distribution, making it easier to interpret trends and patterns.
2. Accurate Data Representation
Proper class structures ensure that data points are accurately represented in the appropriate classes.
3. Informed Decision-Making
Understanding class structures empowers analysts to make more informed decisions based on a comprehensive analysis of data.
Conclusion
Decoding frequency distributions through class structures is a powerful way to make sense of data variability and occurrence patterns. By strategically constructing class intervals, boundaries, and widths, you can transform raw data into a clear and insightful representation. Ultimately, grasping the nuances of class structures equips you with the skills to perform meaningful data analysis and draw valuable conclusions from your dataset.