Home » Statistics » Likert Scale Responses: Interval Data Interpretation

Likert Scale Responses: Interval Data Interpretation

August 28, 2023 by JoyAnswer.org, Category : Statistics

Are Likert scale responses interval data?Explore the nature of Likert scale responses and their categorization as interval data. Learn how to interpret and analyze data collected using Likert scale responses in a statistical context.


Likert Scale Responses: Interval Data Interpretation

Are Likert scale responses interval data?

Likert scale responses are often treated as ordinal data rather than interval data. Here's why:

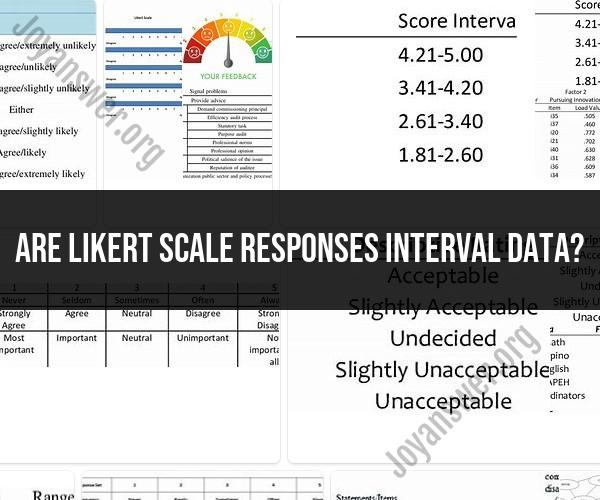
  1. Ordered Categories: Likert scales present respondents with a set of ordered response categories, typically ranging from "Strongly Disagree" to "Strongly Agree" or similar categories. These categories represent different levels of agreement or disagreement, creating a natural order.

  2. Lack of Equal Intervals: In interval data, the intervals between adjacent values are equal and meaningful. For example, on a temperature scale, the difference between 20°C and 30°C is the same as the difference between 70°C and 80°C. In Likert scales, there is no assurance that the intervals between response categories are equal in terms of the underlying attribute being measured (e.g., attitudes or opinions). Respondents might interpret the difference between "Strongly Agree" and "Agree" differently than between "Neutral" and "Disagree."

  3. Arbitrary Zero Point: Interval data typically have a meaningful zero point where the absence of the attribute is represented as zero. For example, a temperature of 0°C represents the absence of heat. In Likert scales, there is no true zero point; "Neutral" does not represent the complete absence of the measured attribute (e.g., satisfaction or agreement).

Because of these characteristics, Likert scale responses are typically considered ordinal data. In ordinal data, you can establish an order or ranking of categories, but you cannot make precise mathematical comparisons between them. For instance, you can say that "Agree" is higher than "Disagree," but you can't claim that it is twice as much agreement.

However, some researchers and statisticians do use Likert scale data as if it were interval data for certain statistical analyses. This is known as an "interval assumption," and it involves assuming that the intervals between the Likert scale response categories are approximately equal for the purpose of conducting certain statistical tests. While this simplification can be useful in some cases, it's important to recognize that it's an assumption and may not hold true in all situations.

If you need to perform more sophisticated statistical analyses that require interval data assumptions, consider using alternative scales or methods that provide truly interval data, such as visual analog scales or numerical rating scales, where the intervals between response points are known and equal.

Tags Likert Scale , Response Data , Data Analysis

People also ask

  • What is a function table calculator?

    A Function Calculator is a free online tool that displays the graph of the given function. BYJU’S online function calculator tool makes the calculations faster, and it displays the graph of the function by calculating the x and y-intercept values, slope values in a fraction of seconds.
    This article introduces the function table calculator and its significance in mathematics and data analysis. It explains how to use the calculator to generate function tables for various mathematical expressions. The step-by-step instructions ensure readers can effectively utilize the tool for their calculations. ...Continue reading

  • How many classes does a frequency distribution have?

    Generally, a frequency distribution has 5 to 15 classes. It presents data in a useful form and allows for a visual interpretation. It enables analysis of the data set including where the data are concentrated / clustered, the range of values, and observation of extreme values, Frequency Table for Qualitative Data
    Delve into the world of frequency distributions and class structures. Understand the various classes that constitute a frequency distribution and the role they play in organizing and interpreting data. ...Continue reading

  • Is a discrete variable normally described as a word?

    Discrete variable is a type of quantitative variable that only take a finite number of numerical values from the defined limits of the variable. It neglects all those values that are in decimal. Discrete variable is also known as categorical variables. Family members of each house in a California street are 5, 3, 6, 5 , 2, 7, 4.
    Explore how discrete variables are described and represented in statistical analysis. Understand the methods used to convey information about discrete variables, extending beyond verbal descriptions. ...Continue reading

The article link is https://joyanswer.org/likert-scale-responses-interval-data-interpretation, and reproduction or copying is strictly prohibited.