What is the difference between correlation and simple regression?
Correlation and simple regression are both statistical techniques used to analyze the relationship between two variables, but they serve different purposes and have distinct characteristics. Here's a breakdown of the key differences between correlation and simple regression:
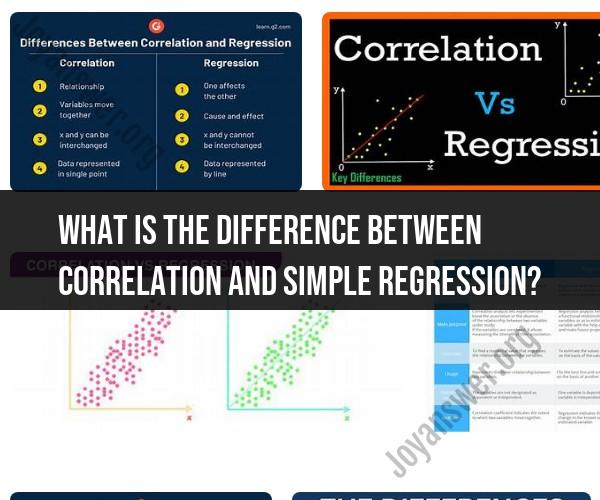
Correlation:
Purpose: Correlation measures the strength and direction of a linear relationship between two variables. It assesses whether and how two variables are related to each other.
Type of Analysis: It is a descriptive statistic used to summarize the association between variables. Correlation doesn't imply causation; it only shows the degree and direction of the relationship.
Output: The output of a correlation analysis is a correlation coefficient (typically the Pearson correlation coefficient, denoted as "r"). The value of "r" ranges from -1 to 1, where -1 indicates a perfect negative correlation, 1 indicates a perfect positive correlation, and 0 indicates no linear correlation.
Equation: The formula for calculating the Pearson correlation coefficient is complex and involves calculating covariances and variances between the variables.
Number of Variables: Correlation deals with two variables (bivariate analysis).
Simple Regression:
Purpose: Simple regression is used to model and predict the relationship between two variables. It seeks to establish a cause-and-effect relationship where one variable (the independent variable) is used to predict or explain changes in another variable (the dependent variable).
Type of Analysis: It is a predictive modeling technique that attempts to create a linear equation to estimate one variable based on the other. Simple regression assumes a causal relationship.
Output: The output of simple regression is a regression equation (a straight line) that represents the relationship between the two variables. This equation is used to make predictions.
Equation: The equation for simple linear regression is typically expressed as:Y = a + bXwhere Y is the dependent variable, X is the independent variable, "a" is the intercept, and "b" is the slope of the line. These values are estimated from the data.
Number of Variables: Simple regression involves two variables, just like correlation. However, in simple regression, one variable is considered the independent variable, and the other is the dependent variable.
In summary, the primary difference between correlation and simple regression lies in their purpose and the nature of the analysis. Correlation assesses the strength and direction of the linear relationship between two variables without implying causation. Simple regression, on the other hand, is used to establish a predictive relationship between two variables, with one variable used to explain or predict changes in the other. It involves fitting a linear equation to the data and inferring a cause-and-effect relationship between the variables.
Correlation vs. Simple Regression: Distinguishing Statistical Techniques
Correlation and simple regression are two statistical techniques that are used to measure the relationship between two variables. However, there are some important distinctions between the two methods.
Correlation is a measure of the strength and direction of the linear relationship between two variables. It is represented by a correlation coefficient, which can range from -1 to 1. A correlation coefficient of 0 indicates no linear relationship between the two variables, while a correlation coefficient of 1 or -1 indicates a perfect linear relationship.
Simple regression is a statistical model that is used to predict the value of one variable (the dependent variable) based on the value of another variable (the independent variable). Simple regression is based on the assumption that the relationship between the two variables is linear.
Exploring the Relationship Between Correlation and Simple Regression
Correlation and simple regression are related in that they both involve measuring the relationship between two variables. However, there is an important distinction between the two methods.
Correlation measures the strength and direction of the linear relationship between two variables, while simple regression measures the predictive power of the independent variable on the dependent variable.
When to Use Correlation Analysis and When to Opt for Simple Regression
Correlation analysis is appropriate when you want to measure the strength and direction of the relationship between two variables. Simple regression is appropriate when you want to predict the value of the dependent variable based on the value of the independent variable.
For example, you might use correlation analysis to investigate the relationship between height and weight. You could also use correlation analysis to investigate the relationship between student attendance and academic performance.
You might use simple regression to predict student test scores based on their attendance. You could also use simple regression to predict sales revenue based on advertising spending.
Practical Examples of Correlation and Simple Regression in Research
Correlation and simple regression are widely used in a variety of research fields, including education, psychology, business, and economics.
Here are a few examples:
- An educational researcher might use correlation analysis to investigate the relationship between student attendance and academic performance.
- A psychologist might use simple regression to predict student test scores based on their IQ scores.
- A business researcher might use correlation analysis to investigate the relationship between advertising spending and sales revenue.
- An economist might use simple regression to predict GDP growth based on inflation rates.
The Significance of Dependent and Independent Variables in Both Methods
In both correlation analysis and simple regression, it is important to identify the dependent and independent variables. The dependent variable is the variable that you are trying to predict or explain. The independent variable is the variable that you are using to predict or explain the dependent variable.
For example, in the example of predicting student test scores based on attendance, the dependent variable is test scores and the independent variable is attendance.
It is important to note that correlation and simple regression cannot be used to establish causality. Just because two variables are correlated does not mean that one variable causes the other variable to change.
However, correlation and simple regression can be useful tools for identifying potential relationships between variables and for making predictions.