What is the function of a normal curve?
A normal curve, also known as a Gaussian curve or a bell curve, is a symmetrical probability distribution that has several important functions in statistics and probability theory. The primary function of a normal curve is to describe the distribution of data or random variables in a variety of real-world situations. Here are some key functions and properties of a normal curve:
Describing Data Distribution: The normal curve is often used to model the distribution of data in situations where the data follows a bell-shaped pattern. Many natural phenomena and human attributes, such as heights, weights, test scores, and IQ scores, tend to be approximately normally distributed.
Central Limit Theorem: The normal curve plays a fundamental role in the Central Limit Theorem, which states that the sampling distribution of the sample mean (averages) of a large number of independent and identically distributed random variables will be approximately normally distributed, regardless of the shape of the original population distribution. This theorem is crucial in inferential statistics.
Statistical Inference: In hypothesis testing and confidence interval estimation, the normal curve is used as the theoretical basis for making statistical inferences. It helps in determining the likelihood of observing certain sample statistics under different conditions.
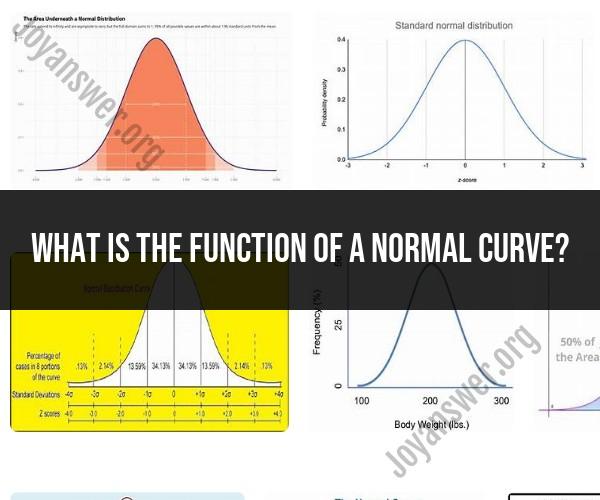
Z-Scores: The normal curve is used to calculate z-scores (standard scores), which indicate how many standard deviations a data point is from the mean. Z-scores are essential for comparing and interpreting data across different distributions.
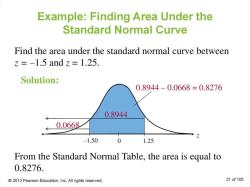
Probability Calculations: The area under the normal curve represents probabilities. By calculating the area between specific values on the curve, you can determine the probability of observing data within a certain range. This is often used in statistical hypothesis testing and confidence interval construction.
Parameter Estimation: In many statistical estimation techniques, the normal distribution is used as an assumed underlying distribution. Maximum likelihood estimation and least squares regression are examples where the normal distribution is frequently assumed.
Quality Control: In quality control and process management, the normal curve is used to monitor and control processes. It helps in identifying deviations from expected performance.
Risk Assessment: In finance and risk assessment, the normal distribution is used to model asset returns, price movements, and risk factors in various financial models.
Predictive Modeling: In predictive modeling and machine learning, the normal distribution assumption is sometimes used for modeling errors or residuals in regression analysis.
Overall, the normal curve serves as a fundamental tool for statisticians and researchers to understand, model, and analyze data distributions. Its mathematical properties, including symmetry and well-defined probabilities, make it a versatile and widely applicable probability distribution.
The Normal Curve Function: Its Role in Statistics and Analysis
The normal curve function, also known as the Gaussian distribution, is a bell-shaped curve that is used in statistics and analysis to describe the distribution of many naturally occurring phenomena.
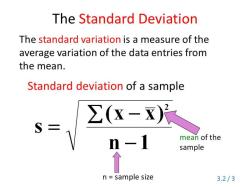
The normal curve function is characterized by two parameters: the mean and the standard deviation. The mean is the average value of the data, and the standard deviation is a measure of how spread out the data is around the mean.
The normal curve function is important in statistics and analysis because it can be used to:
- Calculate the probability of a particular value occurring
- Make inferences about populations based on samples
- Compare different datasets
- Develop statistical models
Understanding the Normal Curve: A Crucial Tool in Data Interpretation
The normal curve can be used to interpret data in a number of ways. For example, it can be used to:
- Identify outliers: Outliers are data points that fall far outside of the normal range. By identifying outliers, we can better understand the distribution of the data and identify any potential problems with the data.
- Identify trends: The normal curve can be used to identify trends in the data, such as whether the data is increasing, decreasing, or remaining stable over time.
- Make predictions: The normal curve can be used to make predictions about the likelihood of a particular event occurring. For example, we can use the normal curve to predict the number of customers who will visit a store on a given day.
Insights into the Normal Curve: Why It Matters in Statistics
The normal curve is an important tool in statistics because it is a good approximation of the distribution of many naturally occurring phenomena. For example, the heights of people, the weights of objects, and the scores on tests are all approximately normally distributed.
This means that the normal curve can be used to model a wide variety of data sets. This makes it a very versatile tool for statistical analysis.
Here are some examples of how the normal curve is used in real-world applications:
- Quality control: The normal curve is used in quality control to identify products that do not meet specifications.
- Medical research: The normal curve is used in medical research to compare the effects of different treatments and to identify new drugs.
- Financial markets: The normal curve is used in financial markets to predict the behavior of stock prices and other financial assets.
The normal curve is a powerful tool that can be used to gain insights into a wide variety of data sets. By understanding the normal curve, we can better understand the world around us and make better decisions.