What are inferential statistics used for?
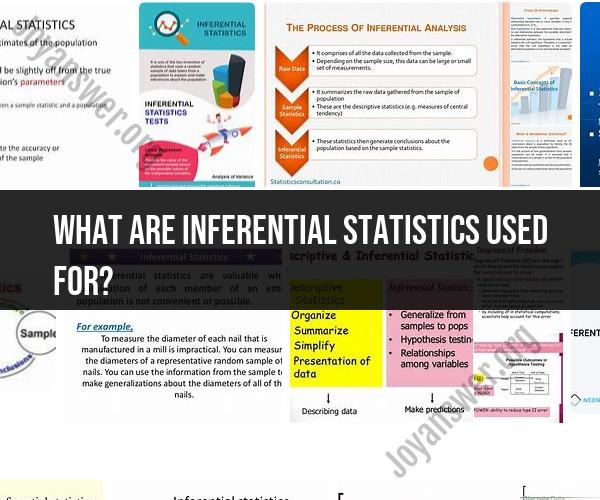
Inferential statistics is a branch of statistics that is used for drawing conclusions, making predictions, and making inferences about a population based on a sample of data. It plays a crucial role in research, data analysis, and decision-making in various fields. Here are some common purposes and uses of inferential statistics:
Generalization: Inferential statistics allows researchers to make generalizations about a larger population based on a representative sample. Instead of collecting data from an entire population, which may be impractical or impossible, researchers gather data from a sample and use inferential statistics to draw conclusions about the entire population.
Hypothesis Testing: Inferential statistics is used to test hypotheses and make informed decisions about whether observed differences or relationships in data are statistically significant or merely due to random chance. This is often done through hypothesis tests, such as t-tests, chi-square tests, and analysis of variance (ANOVA).
Prediction: Inferential statistics can be used to make predictions about future outcomes or events. For example, regression analysis is a technique used to predict a dependent variable based on one or more independent variables.
Estimation: Inferential statistics provides methods for estimating population parameters, such as means, proportions, variances, and more, based on sample data. Confidence intervals are commonly used for parameter estimation.
Comparison: Researchers use inferential statistics to compare groups, conditions, or treatments to determine whether there are significant differences or associations. This is commonly done in experimental studies and clinical trials.
Decision-Making: Inferential statistics provides a basis for informed decision-making. For example, in business, it can be used to assess the effectiveness of marketing campaigns, optimize production processes, or make investment decisions.
Risk Assessment: Inferential statistics can help assess and quantify risks associated with various scenarios. This is crucial in fields like finance, insurance, and healthcare.
Quality Control: Industries such as manufacturing and healthcare use inferential statistics to monitor and control product quality, ensuring that products or services meet established standards.
Market Research: Inferential statistics are applied in market research to understand consumer preferences, forecast market trends, and make pricing decisions.
Policy and Government: In the public sector, inferential statistics are used for policy analysis, program evaluation, and making decisions about resource allocation and public services.
Scientific Research: In scientific research, inferential statistics help researchers determine whether their findings are statistically significant and can be generalized to broader scientific principles.
Social Sciences: Inferential statistics are widely used in psychology, sociology, and other social sciences to analyze survey data, experimental results, and observational studies.
Inferential statistics relies on probability theory and mathematical models to make valid inferences about populations based on sample data. It helps researchers and decision-makers make evidence-based conclusions and predictions, ultimately aiding in informed and data-driven decision-making across various domains.
Exploring the Purpose and Applications of Inferential Statistics
Inferential statistics is a branch of statistics that uses data from a sample to make inferences about a population. Inferential statistics can be used to estimate population parameters, test hypotheses, and make predictions.
Some common applications of inferential statistics include:
- Estimating population parameters. For example, you could use inferential statistics to estimate the average height of all adults in the United States.
- Testing hypotheses. For example, you could use inferential statistics to test the hypothesis that there is a difference in the average height of men and women.
- Making predictions. For example, you could use inferential statistics to predict the number of people who will vote in the next election.
How Inferential Statistics Enhance Data Analysis
Inferential statistics enhances data analysis by allowing us to draw conclusions about a population based on data from a sample. This is important because it is often impractical or impossible to collect data from an entire population. For example, it would be impractical to measure the height of every adult in the United States. However, we can use inferential statistics to estimate the average height of all adults in the United States by measuring the height of a sample of adults.
Inferential statistics also allows us to test hypotheses about populations. This is important because it allows us to determine whether or not there is a real relationship between two or more variables. For example, we could use inferential statistics to test the hypothesis that there is a relationship between height and weight.
Making Inferences: The Role of Inferential Statistics in Research
Inferential statistics plays a vital role in research. It allows researchers to draw conclusions about their findings and to make inferences about the population that their sample represents.
For example, a researcher might conduct a study to investigate the relationship between smoking and lung cancer. The researcher might collect data on a sample of people, some of whom smoke and some of whom do not. The researcher could then use inferential statistics to test the hypothesis that there is a relationship between smoking and lung cancer. If the researcher finds that there is a statistically significant relationship between smoking and lung cancer, they can conclude that smoking is a risk factor for lung cancer.
Inferential statistics is a powerful tool that can be used to make inferences about populations based on data from samples. It is an essential tool for researchers and anyone else who wants to draw meaningful conclusions from data.
