What is the area of a standard normal curve?
The area under a standard normal curve (also known as a z-distribution or z-curve) is always equal to 1. The standard normal curve is a specific type of normal distribution with a mean () of 0 and a standard deviation () of 1.
In a standard normal distribution:
- Mean (): The center of the distribution is at 0.
- Standard Deviation (): The measure of the spread of the distribution is 1.
The area under the entire curve represents the total probability, and this area is equal to 1. This is a fundamental property of probability distributions, including the normal distribution.
When working with specific ranges or intervals on the standard normal curve, you might use z-scores to determine the probability associated with those intervals. A z-score is a measure of how many standard deviations a data point is from the mean in a standard normal distribution.
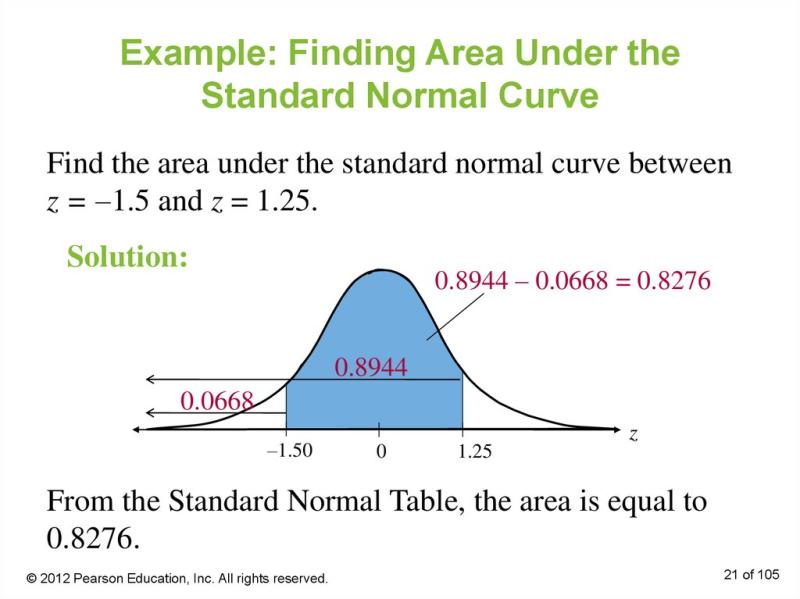
For example, if you want to find the probability that a randomly selected value from a standard normal distribution is between -1 and 1 (i.e., the area under the curve between -1 and 1), you can look up these z-scores in a standard normal distribution table or use statistical software to find the corresponding probabilities.
In summary, the total area under the standard normal curve is always 1, and when working with specific intervals, the area represents the probability associated with those intervals.
Statistical insights: Understanding the area of a standard normal curve
The standard normal curve, also known as the Gaussian distribution, is a bell-shaped curve that represents the probability distribution of a random variable with a mean of 0 and a standard deviation of 1. The area under the standard normal curve represents the probability that a standard normal variable will fall within a certain range of values.
Z-scores and probabilities: Calculating areas under the standard normal distribution
Z-scores, also known as standard scores, represent the number of standard deviations a specific point is away from the mean of the distribution. By converting a raw score into a z-score, we can use the standard normal distribution table or a calculator to determine the probability that the standard normal variable will fall below, above, or between specific z-scores.
Practical applications: How the area of a standard normal curve informs statistical analysis
The area under the standard normal curve has numerous practical applications in various fields, including:
Statistical inference: Calculating confidence intervals and p-values for hypothesis testing.
Quality control: Assessing the quality of products and processes based on their deviation from standard specifications.
Risk assessment: Evaluating the likelihood of adverse events occurring in various scenarios.
Financial modeling: Analyzing financial markets and predicting price movements.
Graphical representation: Visualizing the area under the standard normal curve
The standard normal curve is typically represented graphically as a bell-shaped curve, with the x-axis representing z-scores and the y-axis representing the probability density. The total area under the curve is equal to 1, representing the certainty that the standard normal variable will fall within a certain range of values.
Advanced concepts: Exploring nuances in calculating areas for specific z-values
While the standard normal curve table provides the area below a specific z-score, calculating the area between two z-scores or above a specific z-score requires additional steps. These calculations often involve using mathematical formulas or statistical software.
In summary, the area under the standard normal curve is a fundamental concept in statistics with wide-ranging applications. By understanding the relationship between z-scores and probabilities, we can effectively analyze data, make informed decisions, and solve real-world problems.