What is the difference between discrete and continuous variance?
Variance is a statistical measure that quantifies the spread or dispersion of data points in a dataset. Understanding the differences in variance between discrete and continuous variables is essential for effective data analysis. Here's a closer look at these differences:
Discrete Variables:
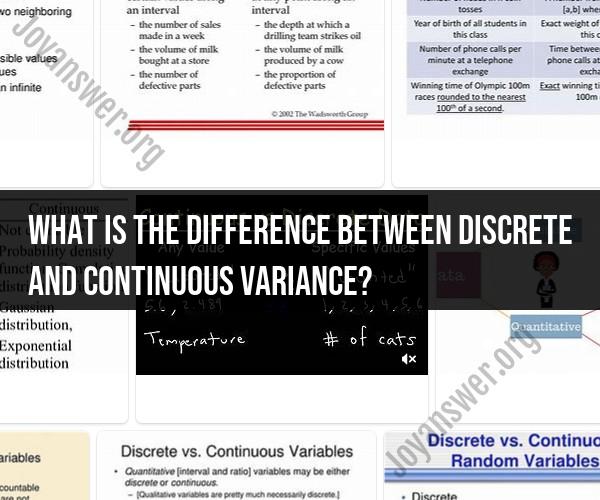
Discrete variables are distinct and separate values that can only take specific, individual values within a certain range. They often represent counts or whole numbers and cannot have values in between. Examples of discrete variables include the number of students in a classroom, the number of cars in a parking lot, and the number of goals scored in a soccer game.
Continuous Variables:
Continuous variables, on the other hand, can take any value within a certain range, including fractions and decimals. These variables are not limited to specific, distinct values and can have an infinite number of possible values. Examples of continuous variables include height, weight, temperature, and time.
Variance in Discrete Variables:
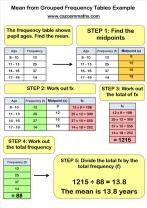
When calculating the variance for discrete variables, the formula involves finding the average of the squared differences between each data point and the mean of the dataset. This gives us an idea of how much individual data points deviate from the mean value.
Variance in Continuous Variables:
Calculating the variance for continuous variables is similar to the process for discrete variables. However, since continuous variables can take any value within a range, the formula involves integrating the squared differences between the data points and the mean over the entire range of values. This provides a measure of how much the data is spread out across the entire range.
Interpreting Variance:
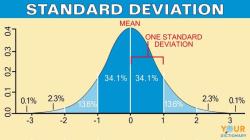
A higher variance indicates greater variability or dispersion of data points from the mean, while a lower variance indicates less variability. Variance is a crucial statistic in understanding the distribution of data and assessing the consistency of values.
Conclusion:
Understanding the differences in variance calculation and interpretation between discrete and continuous variables is essential for accurate data analysis. By recognizing the unique characteristics of each variable type, researchers and analysts can make informed decisions and draw meaningful insights from their datasets.
