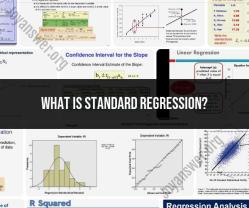
What is standard regression?
Standard regression analysis, also known as linear regression, is a statistical technique used to model the relationship between a dependent variable (or outcome) and one or more independent variables (or predictors). The primary goal of regression analysis is to understand how changes in the independent variables are associated with changes in the dependent variable. In other words, it helps in predicting the value of the dependent variable based on the values of the independent variables.
Here are the key components and concepts associated with standard regression analysis:
Dependent Variable (Y): This is the variable you want to predict or explain. It is also called the response variable or outcome variable. In a simple linear regression, there is only one dependent variable, but in multiple regression, there can be several.
Independent Variables (X): These are the variables that you believe may influence or explain changes in the dependent variable. In simple linear regression, there is one independent variable, while in multiple regression, there are two or more.
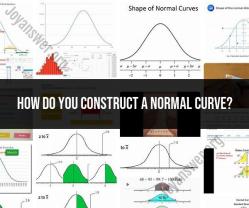
Linear Relationship: The regression assumes a linear relationship between the independent variables and the dependent variable. This means that changes in the independent variables are assumed to result in a constant change in the dependent variable.
Regression Equation: The regression equation represents the mathematical relationship between the dependent and independent variables. In simple linear regression, the equation takes the form:
Y = β0 + β1X + ε
- Y represents the dependent variable.
- β0 is the intercept (the value of Y when X is 0).
- β1 is the regression coefficient, representing the change in Y for a one-unit change in X.
- X is the independent variable.
- ε is the error term, representing the unexplained variability in Y.
Least Squares Method: Standard regression analysis uses the least squares method to estimate the values of the regression coefficients (β0 and β1). The goal is to minimize the sum of the squared differences between the observed values of Y and the predicted values based on the regression equation.
Residuals: Residuals are the differences between the observed values of the dependent variable and the predicted values from the regression equation. Residual analysis is important for assessing the model's goodness of fit.
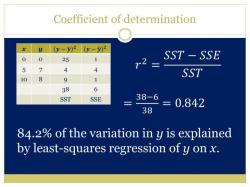
Goodness of Fit: Goodness of fit measures, such as the coefficient of determination (R-squared), assess how well the regression model explains the variability in the dependent variable. A higher R-squared value indicates a better fit.
Hypothesis Testing: Hypothesis tests can be conducted to determine whether the regression coefficients are statistically significant. This helps in assessing whether the independent variables have a significant impact on the dependent variable.
Standard regression analysis is widely used in various fields, including economics, finance, social sciences, and natural sciences, to analyze and model relationships between variables, make predictions, and gain insights into data patterns. It serves as a fundamental tool in statistical analysis and decision-making.
Standard Regression: An Overview of Statistical Analysis
Standard regression is a statistical method for modeling the relationship between two or more variables. It is a powerful tool for understanding complex relationships and making predictions.
Standard regression is based on the following assumptions:
- The relationship between the variables is linear.
- The independent variables are not correlated with each other.
- The errors are normally distributed.
Regression Analysis Essentials: Understanding Standard Procedures
To perform a standard regression analysis, the following steps are typically followed:
- Collect data on the independent and dependent variables.
- Choose a regression model.
- Estimate the model parameters.
- Assess the model fit.
- Make predictions and interpret the results.
The Science of Regression: Exploring the Standard Approach
The standard approach to regression analysis is based on the principle of least squares. This means that the model parameters are estimated in such a way as to minimize the sum of the squared errors.
The estimated model parameters can be used to make predictions about the dependent variable, given the values of the independent variables. The model parameters can also be interpreted to understand the relationship between the variables.
Here are some examples of how standard regression can be used:
- Predicting student test scores based on their study habits and socioeconomic status.
- Predicting the price of a house based on its square footage, location, and other features.
- Predicting the number of customers who will visit a store on a given day based on the weather forecast and other factors.
Standard regression is a powerful tool that can be used to model a wide variety of relationships. It is a versatile tool that can be used in many different fields, including business, economics, finance, and the sciences.
Here are some additional tips for using standard regression:
- Make sure that your data meets the assumptions of the regression model.
- Use a variety of diagnostic tools to assess the model fit.
- Be careful not to overinterpret the results of the regression analysis.
Remember, standard regression is a tool for understanding relationships and making predictions. It is not a magic bullet that can solve all of your problems.