What are the merits and demerits of mean median and mode?
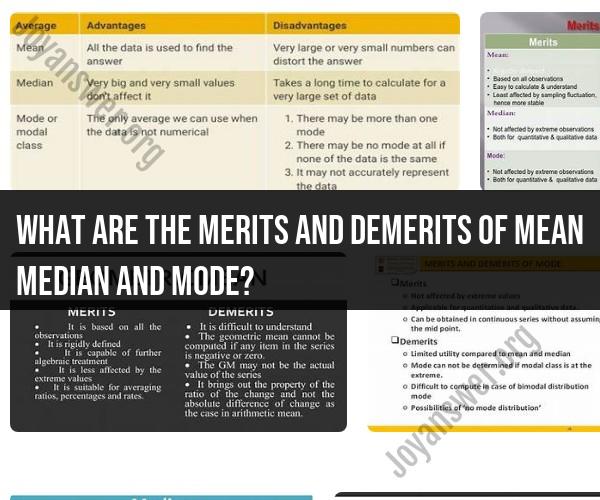
Mean, median, and mode are statistical measures used to describe and summarize data. Each of these measures has its own merits and demerits, which make them suitable for different situations. Here's an overview of the advantages (merits) and disadvantages (demerits) of mean, median, and mode:
Mean:
- Merits:
- Sensitive to All Data Points: The mean considers all data points in its calculation, providing a comprehensive measure of central tendency.
- Mathematical Utility: The mean is essential in many mathematical and statistical formulas, making it a versatile measure.
- Balancing Act: It balances the positive and negative deviations from the central value, which can provide valuable insights.
- Demerits:
- Susceptible to Outliers: Outliers (extreme values) can significantly impact the mean, causing it to be unrepresentative of the typical data. This can result in misleading conclusions.
- Not Suitable for Skewed Data: In skewed distributions, the mean may not accurately represent the center due to its sensitivity to extreme values.
Median:
- Merits:
- Robust to Outliers: The median is resistant to the influence of outliers, making it a robust measure of central tendency.
- Appropriate for Ordinal Data: It can be used with ordinal data (data with an inherent order but not necessarily equal intervals), where the mean is not meaningful.
- Simple to Compute: Calculating the median involves sorting the data and selecting the middle value, making it easy to understand and compute.
- Demerits:
- May Not Be Unique: In cases where there are an even number of data points, there is no unique median, as there are two middle values.
- Does Not Utilize All Data: The median does not take into account all data points, which can be a limitation when a more complete representation of the data is required.
Mode:
- Merits:
- Simple and Intuitive: The mode is straightforward to understand and easy to compute, even for non-statisticians.
- Useful for Categorical Data: The mode is particularly useful for categorical data, such as colors, categories, or names.
- Multiple Modes Possible: Unlike the mean and median, data can have multiple modes, reflecting the presence of several prominent values.
- Demerits:
- May Not Exist or Be Uninformative: Some datasets have no mode (no value repeated) or may have many modes without a clear central value, making it uninformative in such cases.
- Not Effective for Continuous Data: The mode is less meaningful when dealing with continuous data or data with a large number of distinct values.
In summary, the choice of whether to use mean, median, or mode depends on the nature of the data and the specific goals of the analysis. Mean is often appropriate for data with a symmetric distribution, median is robust to outliers and skewed data, and mode is well-suited for categorical data. It's common to use multiple measures together to gain a more comprehensive understanding of the data's central tendency and dispersion.
The Merits and Applications of Mean, Median, and Mode
Mean, median, and mode are the three most common measures of central tendency in statistics. Central tendency is a measure of the "middle" of a data set, and can be used to describe the overall trend of the data.
Mean (average)
The mean is calculated by adding up all of the values in a data set and dividing by the number of values. The mean is a good measure of central tendency for data sets that are symmetrical and have no outliers.
Median
The median is calculated by arranging the values in a data set in order from least to greatest and finding the middle value. If there are two middle values, the median is the average of those two values. The median is a good measure of central tendency for data sets that are skewed or have outliers.
Mode
The mode is the most frequent value in a data set. The mode is a good measure of central tendency for data sets that have one or two dominant values.
Applications
Mean, median, and mode can be used in a variety of applications, such as:
- Data analysis: Mean, median, and mode can be used to analyze data and identify trends and patterns.
- Decision-making: Mean, median, and mode can be used to make decisions about data, such as setting targets or allocating resources.
- Communication: Mean, median, and mode can be used to communicate data to others in a clear and concise way.
Using the Mean (Average) for Data Analysis
The mean is a good measure of central tendency for data sets that are symmetrical and have no outliers. To use the mean for data analysis, you can follow these steps:
- Calculate the mean by adding up all of the values in the data set and dividing by the number of values.
- Interpret the mean. The mean represents the overall trend of the data set. For example, if the mean is high, it means that the data set is generally skewed towards higher values.
- Compare the mean to other measures of central tendency, such as the median and mode. This can help you to understand the distribution of the data and to identify any outliers.
When to Choose the Median for Central Tendency
The median is a good measure of central tendency for data sets that are skewed or have outliers. To use the median for central tendency, you can follow these steps:
- Arrange the values in the data set in order from least to greatest.
- Find the middle value. If there are two middle values, the median is the average of those two values.
- Interpret the median. The median represents the middle value of the data set. It is not affected by outliers or skewness.
Understanding the Mode in Data Sets
The mode is the most frequent value in a data set. To find the mode, you can follow these steps:
- Count the number of times each value appears in the data set.
- The mode is the value that appears the most often.
Comparing and Contrasting Mean, Median, and Mode in Statistics
The mean, median, and mode are all measures of central tendency, but they have different strengths and weaknesses.
Mean
- Strengths: The mean is easy to calculate and interpret. It is also a good measure of central tendency for data sets that are symmetrical and have no outliers.
- Weaknesses: The mean is affected by outliers and skewness. This means that it may not be a representative measure of central tendency for data sets that are skewed or have outliers.
Median
- Strengths: The median is not affected by outliers or skewness. This makes it a good measure of central tendency for data sets that are skewed or have outliers.
- Weaknesses: The median can be difficult to calculate for data sets with a large number of values. It is also not as easy to interpret as the mean.
Mode
- Strengths: The mode is easy to calculate and interpret. It is also a good measure of central tendency for data sets that have one or two dominant values.
- Weaknesses: The mode is not a good measure of central tendency for data sets that have many different values or no dominant values.
Which measure of central tendency to use
The best measure of central tendency to use depends on the specific data set and the purpose of the analysis. If the data set is symmetrical and has no outliers, the mean is a good choice. If the data set is skewed or has outliers, the median is a better choice. If the data set has one or two dominant values, the mode may be a good choice.