What does a normal distribution look like?
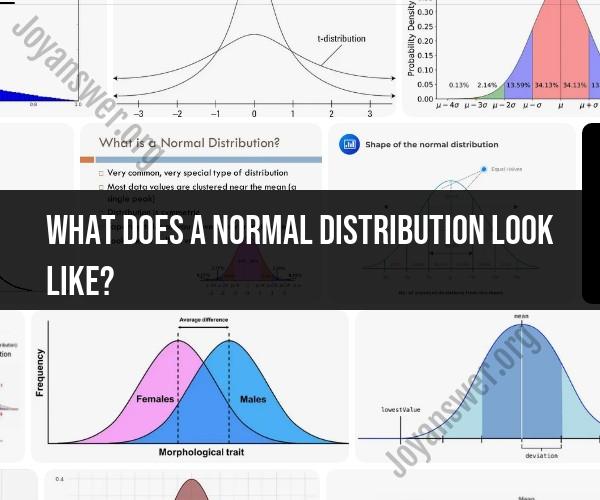
A normal distribution, also known as a Gaussian distribution or a bell curve, has a distinct and characteristic appearance that is defined by several key features:
Symmetry: A normal distribution is perfectly symmetrical. The left and right sides of the curve are mirror images of each other, and the highest point of the curve, the peak or mode, is at the center.
Bell-Shaped Curve: The shape of a normal distribution resembles a bell, with a single, smooth, and continuous peak. It tapers off gradually as you move away from the center in both directions.
Unimodal: A normal distribution is unimodal, meaning it has one clear peak. It does not have multiple peaks or modes.
Central Tendency: The highest point on the curve represents the mean (average) of the data. In a perfectly normal distribution, the mean, median, and mode are all the same and located at the center of the distribution.
Spread and Dispersion: The spread or dispersion of data in a normal distribution is determined by the standard deviation. A larger standard deviation results in a wider curve, indicating greater variability in the data, while a smaller standard deviation results in a narrower curve, indicating less variability.
Asymptotic Tails: The tails of a normal distribution approach but never touch the x-axis (horizontal axis) as they extend infinitely in both directions. This implies that there is a very low but non-zero probability of observing extreme values far from the mean.
68-95-99.7 Rule: Approximately 68% of the data falls within one standard deviation of the mean, about 95% within two standard deviations, and nearly 99.7% within three standard deviations. This rule is also known as the empirical rule or the 3-sigma rule.
Continuous Distribution: A normal distribution is continuous, meaning that it represents a range of possible values rather than specific data points. It is defined for all real numbers.
Probability Density Function (PDF): The probability density function of a normal distribution is a mathematical expression that describes the likelihood of observing specific values within the distribution. It's represented by the bell-shaped curve.
It's important to note that while the properties described above characterize a theoretical normal distribution, real-world data often exhibits some degree of deviation from perfect normality. Statisticians and data analysts use statistical tests and graphical tools to assess how closely a dataset approximates a normal distribution.
The normal distribution is a fundamental concept in statistics and plays a crucial role in various fields, including probability theory, hypothesis testing, and modeling natural phenomena. Many real-world phenomena, such as height and IQ scores in a population, tend to follow approximately normal distributions, which makes the normal distribution a valuable tool for understanding and analyzing data.
Visualizing Data: What Does a Normal Distribution Look Like?
A normal distribution is a bell-shaped curve that is often used to visualize data. It is symmetrical, meaning that the left and right halves of the curve are mirror images of each other. The peak of the curve represents the most common value in the data set, and the tails of the curve represent the less common values.
Recognizing the Bell Curve: Characteristics of a Normal Distribution
There are a number of characteristics that can be used to identify a normal distribution:
- Symmetry: The normal distribution is symmetrical, meaning that the left and right halves of the curve are mirror images of each other.
- Unimodality: The normal distribution has a single peak, which represents the most common value in the data set.
- Curtosis: The normal distribution has a kurtosis of zero, which means that it is neither too peaked nor too flat.
- Skewness: The normal distribution has a skewness of zero, which means that it is perfectly symmetrical.
Graphical Representation of Normal Distribution in Statistics
The normal distribution is often represented graphically using a histogram or a normal curve. A histogram is a bar chart that shows the frequency of each value in the data set. A normal curve is a bell-shaped curve that represents the probability of observing each value in the data set.
Normal distributions are commonly used in statistics because they are a good approximation for many real-world data sets. For example, the heights of adult humans are normally distributed, as are the scores on many standardized tests.
Normal distributions can be used to make inferences about the population from which the data set was drawn. For example, if we know that the heights of adult humans are normally distributed with a mean of 68 inches and a standard deviation of 3 inches, we can estimate that 95% of adult humans have heights between 61 and 75 inches.
Normal distributions are a powerful tool for visualizing and analyzing data. By understanding the characteristics of normal distributions, we can better understand the data that we are working with and make more informed decisions.