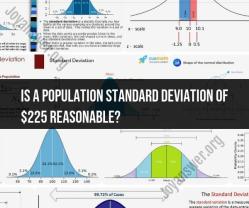
What are some examples of normal distribution?
The normal distribution, also known as the Gaussian distribution or bell curve, is a fundamental concept in statistics and probability theory. It is characterized by a symmetrical, bell-shaped curve and is often used to model random variables in various real-world situations. Here are some examples of normal distribution in everyday life and applications:
Height of Individuals: Human height often follows a normal distribution. In a population, most people tend to cluster around the average height, with fewer individuals being much taller or much shorter. This distribution is essential in fields like health and nutrition.
IQ Scores: Intelligence quotient (IQ) scores are designed to follow a normal distribution with a mean (average) IQ score of 100. IQ tests are standardized to have a standard deviation of 15, which helps create a bell-shaped curve of scores.
Exam Scores: In large-scale standardized tests, such as the SAT or GRE, scores tend to follow a normal distribution. The majority of test-takers score around the mean score, with fewer scoring significantly higher or lower.
Body Temperature: Human body temperature is approximately normally distributed with a mean of 98.6°F (37°C) and a standard deviation of about 0.7°F (0.4°C). Most people have body temperatures close to the mean, with fewer individuals having significantly higher or lower temperatures.
Measurement Errors: In various scientific measurements and experiments, measurement errors often follow a normal distribution. This is crucial for estimating the accuracy and precision of measurements.
Stock Prices: Daily or monthly returns on stock prices for many publicly traded companies tend to follow a normal distribution, at least approximately. This is a fundamental assumption in financial modeling and risk assessment.
Manufacturing Quality Control: Quality control processes in manufacturing often assume that product measurements (e.g., length, weight) follow a normal distribution. Deviations from this distribution may indicate problems in the manufacturing process.
Biological Phenomena: Some biological measurements, such as blood pressure, heart rate, and enzyme activity levels, approximate a normal distribution in a healthy population.
Economics: Various economic variables, such as income, consumption, and inflation rates, can be modeled using normal distribution assumptions in economic analyses.
Random Sampling: In statistics, the central limit theorem states that the distribution of the sample mean of a sufficiently large random sample from any population approaches a normal distribution, regardless of the population's underlying distribution.
It's important to note that while many phenomena in the real world approximate a normal distribution, exact adherence to this distribution is rare. In practice, statisticians often use the normal distribution as an approximation to simplify calculations and make statistical inference more manageable.
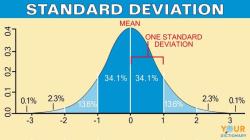
Normal distribution, also known as the bell curve, is a statistical distribution that describes the probability of a variable taking on a certain value. It is a bell-shaped curve with a single peak at the mean, and the tails of the curve taper off to either side.
Normal distribution is very common in nature and can be found in a wide variety of real-life scenarios. Here are a few examples:
- Height of people: The height of people is a classic example of a normal distribution. Most people are of average height, with fewer people being very tall or very short.
- IQ scores: IQ scores are also normally distributed. Most people have IQ scores close to the average, with fewer people having very high or very low IQ scores.
- Test scores: Test scores, such as SAT and ACT scores, are also normally distributed. Most students score close to the average, with fewer students scoring very high or very low.
- Shoe sizes: Shoe sizes are another example of a normal distribution. Most people have average-sized feet, with fewer people having very large or very small feet.
- Error of measurement: When we measure something, there is always a chance of error. This error is often normally distributed.
Here are some more specific examples of normal distribution in practice:
- The number of cars that pass through a certain intersection in an hour.
- The amount of rain that falls in a certain area during a month.
- The number of students who pass a certain class.
- The weight of apples harvested from a certain orchard.
- The lifespan of light bulbs.
Spotting normal distribution patterns in real-world data can be helpful for a variety of reasons. For example, it can help us to identify outliers, predict future values, and make better decisions.
Here are some tips for spotting normal distribution patterns:
- Look at a histogram of the data. A histogram is a bar chart that shows the distribution of the data. If the data is normally distributed, the histogram will be bell-shaped.
- Calculate the mean and standard deviation of the data. The mean is the average value of the data, and the standard deviation is a measure of how spread out the data is. If the data is normally distributed, the mean will be in the middle of the distribution, and the standard deviation will be a measure of how wide the bell curve is.
- Use a normality test. There are a number of statistical tests that can be used to determine whether or not a set of data is normally distributed.
If you are unsure whether or not a set of data is normally distributed, it is always best to consult with a statistician.


