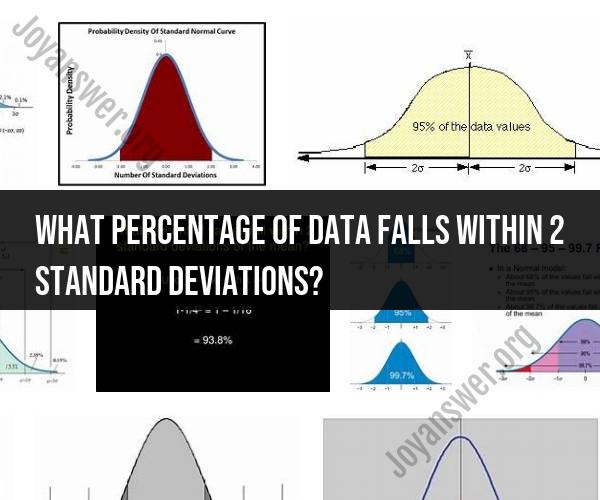
What percentage of data falls within 2 standard deviations?
Data spread is a crucial aspect of understanding the distribution of values in a dataset. Interpreting the percentage of data within two standard deviations from the mean provides valuable insights into the distribution's concentration. In this article, we explore how to analyze and interpret this important metric.
The Importance of Data Spread
Data spread indicates how values are dispersed around the mean. A narrow spread suggests values are closely clustered, while a wider spread indicates greater variability.
Two Standard Deviations Rule
The percentage of data within two standard deviations from the mean is a useful benchmark for analyzing data concentration.
Interpreting the Percentage
A large percentage of data within two standard deviations indicates a concentrated distribution. Conversely, a smaller percentage suggests a more dispersed distribution.
Example:
Suppose a dataset follows a normal distribution. According to the empirical rule, about 68% of data falls within one standard deviation from the mean, and about 95% falls within two standard deviations.
Practical Application
Interpreting data spread helps:
- Identify outliers and anomalies that lie beyond two standard deviations.
- Assess the reliability of statistical analysis based on data concentration.
- Inform decision-making by understanding the extent of data variability.
Conclusion
Understanding the percentage of data within two standard deviations is a valuable tool for assessing data spread and concentration. By interpreting this metric, analysts gain insights into the distribution's characteristics, aiding in better decision-making and statistical analysis.