How can you identify a discrete variable?
Discrete variables are an essential concept in statistics and data analysis. They differ from continuous variables in that they can only take distinct, separate values. In this guide, we will explore the key characteristics of discrete variables and the methods used to identify them.
Key Characteristics of Discrete Variables
- Distinct Values: Discrete variables can only assume specific, separate values, often in the form of integers. These values cannot be subdivided further.
- Countable: Discrete variables typically involve counting or tallying occurrences. They represent quantities that can be enumerated.
- Non-Continuous: Discrete variables lack a continuum of values. There are gaps between each possible value, and no intermediate values exist.
- Specific Categories: Discrete variables often fall into specific categories or classes. For example, the number of students in a classroom or the number of cars in a parking lot.
Methods to Identify Discrete Variables
1. Nature of the Data:
Examine the nature of the data to determine if it represents distinct, separate values. For example, counts of items, people, or events are likely to be discrete variables.
2. Data Type:
Check the data type used to represent the variable. If the variable can only take integer values or specific categories, it is likely a discrete variable.
3. Visualization:
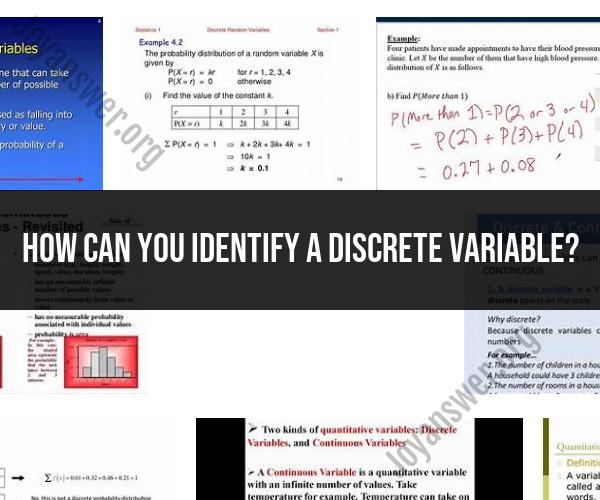
Visualize the data using graphs such as bar charts, histograms, or frequency plots. Discrete variables often result in histograms with distinct bars representing each value.
4. Data Analysis:
Conduct exploratory data analysis to identify patterns and characteristics. Look for distinct values that cannot be subdivided.
5. Variable Context:
Consider the context of the variable. Variables that involve counting, tracking, or categorizing discrete items are more likely to be discrete variables.
Significance of Identifying Discrete Variables
Accurately identifying discrete variables is essential for selecting appropriate statistical methods and analyses. Differentiating between discrete and continuous variables ensures that appropriate data manipulation and interpretation are applied, leading to accurate insights and conclusions.
Conclusion
Understanding the characteristics of discrete variables and utilizing methods to identify them is a fundamental skill in statistics and data analysis. Whether through their distinct values, countable nature, or specific categories, recognizing discrete variables enhances the accuracy and reliability of analyses, leading to informed decision-making.
