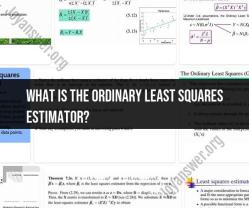
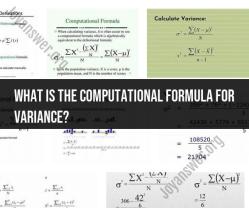
What is the formula for calculating variance?
The variance is a statistical measure that quantifies the spread or dispersion of a set of data points. It provides information about how much individual data points differ from the mean (average) of the data set. The formula for calculating variance depends on whether you are dealing with a sample or the entire population.
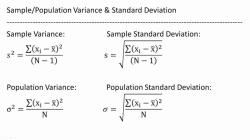
Population Variance (σ²):
The population variance (σ²) is calculated using the following formula:
- is the population variance.
- is the total number of data points in the population.
- represents each individual data point.
- is the mean of the population.
Sample Variance (s²):
If you are dealing with a sample of data rather than the entire population, you would use the sample variance formula:
- is the sample variance.
- is the sample size (total number of data points in the sample).
- represents each individual data point.
- is the sample mean.
In the sample variance formula, note that is used in the denominator. This adjustment is known as Bessel's correction and is applied to correct the bias in the estimation of the population variance from a sample.
Step-by-Step Calculation:
Calculate the Mean:
- Find the mean ( or ) of the data set.
Find the Squared Differences:
- For each data point, subtract the mean and square the result.
Sum the Squared Differences:
- Add up all the squared differences calculated in step 2.
Divide by the Number of Data Points:
- Divide the sum from step 3 by the total number of data points ( for population variance or for sample variance).
The result is the variance, which gives you an indication of the dispersion or variability of the data set. Keep in mind that the square root of the variance is the standard deviation, another commonly used measure of variability.
Demystifying statistics: Understanding the formula for calculating variance
Variance is a statistical measure that quantifies the spread of a data set. It is calculated by taking the average of the squared deviations of each data point from the mean.
The formula for calculating variance is as follows:
Variance = (1 / n - 1) * Σ(x - μ)^2
where:
- n is the number of data points in the set
- x is a data point
- μ is the mean of the data set
Practical applications: How businesses use variance calculations
Businesses use variance calculations in a variety of ways, including:
- To measure the quality of products and services: Businesses can use variance calculations to identify any inconsistencies in their products or services. This can help them to improve the quality of their products and services and reduce customer complaints.
- To track financial performance: Businesses can use variance calculations to track their financial performance over time. This can help them to identify any areas where they need to improve their efficiency or reduce costs.
- To make informed decisions: Businesses can use variance calculations to make informed decisions about their future operations. For example, they can use variance calculations to estimate the costs of launching a new product or expanding into a new market.
Variance vs. standard deviation: Clarifying the differences
Variance and standard deviation are two closely related statistical measures. Variance is a measure of the spread of a data set, while standard deviation is a measure of how spread out the data is around the mean.
The standard deviation is calculated by taking the square root of the variance.
Standard deviation = √variance
Common mistakes: Pitfalls to avoid when calculating variance
Here are some common mistakes to avoid when calculating variance:
- Using the wrong formula: Make sure that you are using the correct formula for calculating variance, depending on whether you are calculating the population variance or the sample variance.
- Not squaring the deviations: When calculating variance, be sure to square the deviations of each data point from the mean.
- Using the wrong number of data points: Make sure that you are using the correct number of data points when calculating variance. The denominator of the variance formula should be n - 1 if you are calculating the sample variance.
Variance calculation tools: Choosing the right method for your data
There are a variety of variance calculation tools available, both online and in software packages such as Excel and SPSS. The best tool for you will depend on the size and complexity of your data set.
If you have a small data set, you can calculate variance manually using the formula above. However, if you have a large or complex data set, it is best to use a variance calculation tool.
Here are some tips for choosing the right variance calculation tool for your data:
- Consider the size and complexity of your data set: If you have a large or complex data set, you will need a tool that can handle large amounts of data.
- Consider the features you need: Some variance calculation tools offer more features than others. For example, some tools can calculate the population variance, while others can only calculate the sample variance.
- Consider the ease of use: Choose a tool that is easy to use and navigate.
- Consider the cost: Some variance calculation tools are free, while others require a subscription.