What is OLS estimator?
OLS stands for Ordinary Least Squares, and it is a method used in statistics and econometrics to estimate the parameters (coefficients) of a linear regression model. The OLS estimator is a statistical technique that finds the best-fitting line through a set of data points. Here's a breakdown of what the OLS estimator is and how it works:
Linear Regression Model: The OLS estimator is primarily used in the context of a linear regression model, which is a mathematical representation of the relationship between a dependent variable (Y) and one or more independent variables (X). The model assumes that this relationship is linear.
Objective: The goal of OLS is to find the line (or hyperplane in the case of multiple independent variables) that minimizes the sum of the squared differences between the observed values of the dependent variable and the values predicted by the model.
Minimization of Residuals: OLS achieves this by minimizing the sum of the squared residuals (or errors). The residual for each data point is the vertical distance between the observed data point and the point on the regression line corresponding to the same value of the independent variable(s).
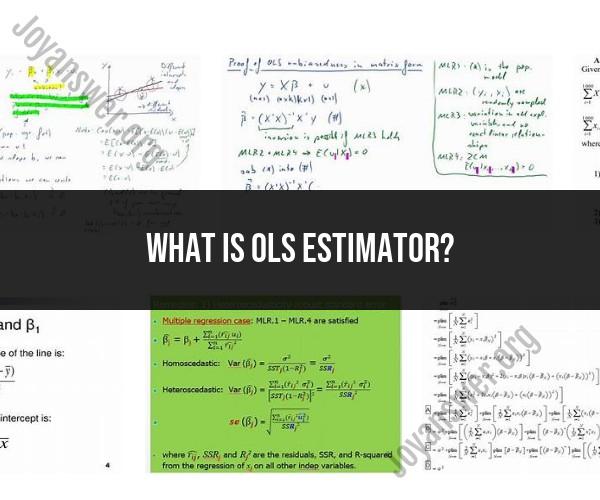
Formula: The formula for the OLS estimator of a simple linear regression model (with one independent variable) can be expressed as follows:
β₁ = Σ((Xi - X̄)(Yi - Ȳ)) / Σ((Xi - X̄)²)
Here, β₁ represents the estimated coefficient for the independent variable, Xi is an individual data point for the independent variable, X̄ is the mean of the independent variable, Yi is an individual data point for the dependent variable, and Ȳ is the mean of the dependent variable.
Interpretation: The OLS estimator provides the best-fitting linear equation of the form Y = β₀ + β₁X, where β₀ is the intercept (the value of Y when X is zero), and β₁ is the slope (the change in Y for a one-unit change in X).
Goodness of Fit: OLS also provides statistics such as R-squared (R²) and the standard error of the estimate, which help assess the goodness of fit of the regression model. R-squared measures the proportion of the variance in the dependent variable that is explained by the independent variable(s).
OLS is widely used in various fields, including economics, finance, social sciences, and natural sciences, for modeling and analyzing relationships between variables. It is a fundamental tool for understanding how changes in independent variables affect the dependent variable and for making predictions based on observed data.
