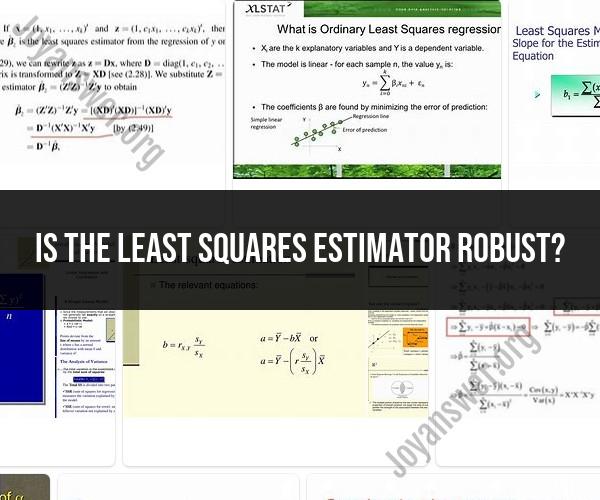
Is the least squares estimator robust?
The least squares estimator (LSE) is widely used in statistics and regression analysis due to its simplicity and efficiency in estimating model parameters. However, whether it is considered "robust" depends on the specific characteristics of the data and the statistical assumptions being made.
Here's a brief overview of the robustness of the LSE:
Robustness to Linearity: LSE is robust when the underlying relationship between the dependent and independent variables is approximately linear. It works well even when the data deviate slightly from perfect linearity. However, if the relationship is highly nonlinear, LSE may produce biased estimates.
Robustness to Outliers: One area where LSE can be less robust is in the presence of outliers. Outliers, or extreme data points, can disproportionately influence the LSE, leading to biased parameter estimates. In such cases, robust regression techniques like robust least squares or M-estimation may be more appropriate.
Robustness to Heteroscedasticity: LSE assumes that the variance of the errors is constant (homoscedasticity). If this assumption is violated and there is heteroscedasticity in the data, LSE can produce inefficient and biased estimates. In such cases, generalized least squares (GLS) or weighted least squares (WLS) can be used to address heteroscedasticity.
Robustness to Multicollinearity: LSE can be sensitive to multicollinearity, which occurs when independent variables are highly correlated. This can lead to unstable estimates and inflated standard errors. Techniques like ridge regression or principal component regression can be more robust in the presence of multicollinearity.
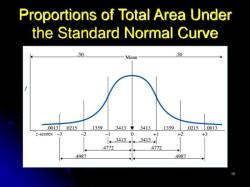
Robustness to Non-Normality: LSE assumes that the errors (residuals) are normally distributed. If the errors are not normally distributed, it can affect the validity of hypothesis tests and confidence intervals based on LSE. Robust regression methods, like quantile regression, can handle non-normally distributed data more effectively.
In summary, the robustness of the LSE depends on the specific characteristics of the data and the assumptions being made. While LSE is a valuable and widely used estimator, there are situations where it may not be the best choice. Researchers and analysts should carefully assess the data and consider alternative estimation techniques when dealing with issues such as outliers, heteroscedasticity, multicollinearity, or non-normality.