What is an example of multiple regression?
Sure, let's consider a hypothetical example of multiple regression in a psychological research context. Suppose a researcher is interested in understanding factors that influence academic performance in college students. The researcher believes that academic performance (measured by GPA) is influenced by various factors, including:
- Study Hours (X1): The number of hours a student spends studying per week.
- High School GPA (X2): The GPA the student achieved in high school.
- Attendance (X3): The percentage of classes the student attends.
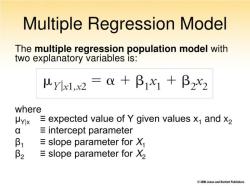
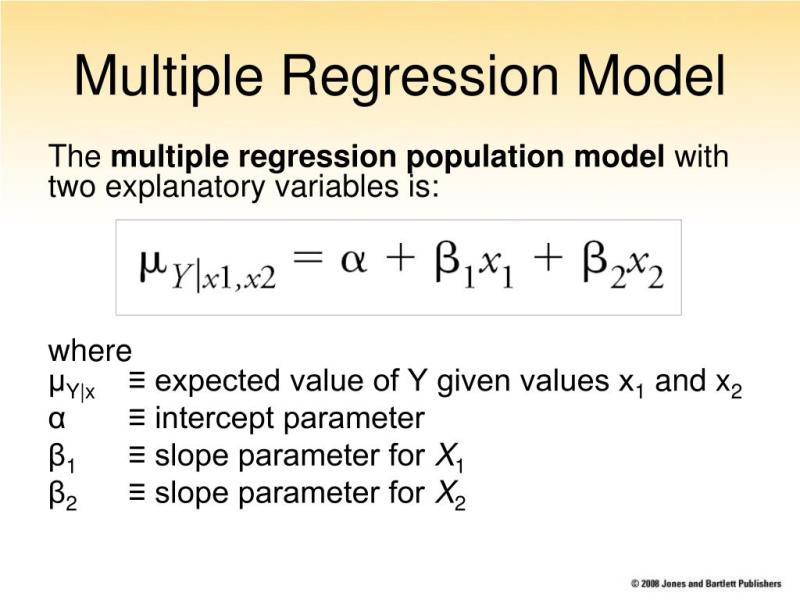
The multiple regression equation to predict college GPA (Y) based on these factors could be expressed as:
Here:
- is the college GPA.
- is the intercept.
- and are the regression coefficients for study hours, high school GPA, and attendance, respectively.
- and are the values of the independent variables (study hours, high school GPA, and attendance) for a given student.
- is the error term.
In this example, the researcher collects data from a sample of college students, measuring their study hours, high school GPA, attendance, and college GPA. The multiple regression analysis helps to estimate the regression coefficients ( and ), providing insights into the strength and direction of the relationships between these factors and college GPA.
The researcher may find that:
- indicates the impact of study hours on college GPA.
- indicates how high school GPA influences college GPA.
- shows the impact of attendance on college GPA.
The researcher can then use the regression equation to predict a student's college GPA based on their study hours, high school GPA, and attendance.
For example, if the analysis reveals that is positive, it suggests that more study hours are associated with a higher college GPA. If is positive, a higher high school GPA is associated with a higher college GPA. If is positive, better attendance is associated with a higher college GPA.
This is a simplified example, and in practice, multiple regression analyses may involve more sophisticated statistical techniques and consideration of additional factors. The goal is to identify the combined impact of multiple variables on an outcome of interest.
Can you provide a practical example of multiple regression in action?
Sure. Here is a practical example of multiple regression in action:
Research question: What are the factors that predict academic success in college students?
Predictor variables:
- High school GPA
- SAT score
- ACT score
- Number of AP classes taken
- Number of extracurricular activities
Outcome variable:
- College GPA
The researchers would collect data on all of the predictor and outcome variables for a sample of college students. They would then use multiple regression to analyze the data and identify the factors that are most predictive of academic success in college students.
The results of the multiple regression analysis might show that high school GPA and SAT score are the two strongest predictors of college GPA. This would suggest that students with higher high school GPAs and SAT scores are more likely to succeed academically in college.
How do researchers use multiple regression in real-world scenarios?
Researchers use multiple regression in real-world scenarios to address a wide range of questions. Here are a few examples:
- Education: Researchers use multiple regression to study the factors that influence student achievement, teacher effectiveness, and school performance.
- Healthcare: Researchers use multiple regression to study the factors that influence disease risk, treatment outcomes, and healthcare costs.
- Business: Researchers use multiple regression to study the factors that influence customer behavior, employee productivity, and company profitability.
- Marketing: Researchers use multiple regression to study the factors that influence consumer attitudes, brand awareness, and purchase decisions.
- Policy: Researchers use multiple regression to study the effects of government policies on economic growth, crime rates, and public health.
What are the benefits of employing multiple regression in data analysis?
Multiple regression offers a number of benefits for data analysis, including:
- Controlling for other variables: Multiple regression allows researchers to control for other variables that may influence the relationship between the predictor and outcome variables. This helps to ensure that the results of the analysis are accurate and reliable.
- Quantifying relationships: Multiple regression provides researchers with a quantitative estimate of the relationship between the predictor and outcome variables. This allows researchers to determine how much each predictor variable contributes to the outcome variable.
- Understanding complex relationships: Multiple regression can be used to study complex relationships between multiple predictor variables and an outcome variable. This can help researchers to better understand the factors that influence a particular outcome.
Overall, multiple regression is a powerful tool for data analysis that can be used to address a wide range of research questions in a variety of fields.