What does completely determine a normal distribution?
A normal distribution, also known as a Gaussian distribution or a bell curve, is a specific type of probability distribution that is characterized by several key properties. While no single factor completely determines a normal distribution, a combination of factors and conditions can help describe and understand it. The defining factors and properties of a normal distribution include:
Symmetry: A normal distribution is symmetric, meaning that it is perfectly balanced around its mean (average). In other words, the left and right sides of the distribution are mirror images of each other.
Unimodality: A normal distribution has a single peak, or mode, at its mean. It is not multimodal, which means it doesn't have multiple distinct peaks.
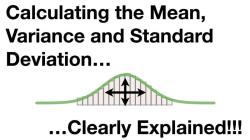
Mean (μ): The mean of a normal distribution represents the central value or average of the data. It is the point around which the data is symmetrically distributed.
Standard Deviation (σ): The standard deviation of a normal distribution measures the spread or dispersion of the data points. It quantifies how much individual data points typically vary from the mean.
Continuous Distribution: A normal distribution is continuous, meaning that it represents a continuous range of values. There are no gaps or missing values within the distribution.
Asymptotic Tails: The tails of a normal distribution approach but never touch the x-axis (horizontal axis). This means that the distribution extends infinitely in both directions.
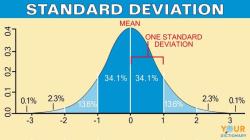
68-95-99.7 Rule: Approximately 68% of the data falls within one standard deviation of the mean, about 95% within two standard deviations, and nearly 99.7% within three standard deviations. This rule is also known as the empirical rule or the 3-sigma rule.
Probability Density Function (PDF): The probability density function of a normal distribution is represented by the bell-shaped curve. It describes the likelihood of observing a specific value within the distribution.
It's important to note that while these factors and properties describe a theoretical normal distribution, real-world data may not perfectly conform to the normal distribution. Many natural phenomena and datasets exhibit some degree of deviation from perfect normality, which is why statistical techniques and tests are used to assess the degree of normality in data.
Additionally, the parameters of a normal distribution (mean and standard deviation) can vary, allowing for a family of normal distributions with different characteristics. In practice, normal distributions are often used as approximations for real-world data, and deviations from perfect normality are accounted for in statistical analysis and modeling.
Factors that Completely Determine a Normal Distribution
A normal distribution is a bell-shaped distribution that is completely determined by two parameters:
- Mean: The mean is the average of the distribution.
- Standard deviation: The standard deviation is a measure of how spread out the distribution is.
The mean and standard deviation completely determine the shape of the normal distribution, as well as the probability of observing any particular value.
Key Parameters Influencing the Shape of a Normal Distribution
The mean and standard deviation are the two most important parameters that influence the shape of a normal distribution. However, there are a few other key parameters that can also affect the shape of the distribution, including:
- Skewness: Skewness is a measure of the asymmetry of the distribution. A normal distribution with a positive skew has a longer tail on the right side, while a normal distribution with a negative skew has a longer tail on the left side.
- Kurtosis: Kurtosis is a measure of the peakedness of the distribution. A normal distribution with a high kurtosis is more peaked than a normal distribution with a low kurtosis.
Statistical Characteristics that Define a Normal Distribution
There are a number of statistical characteristics that can be used to define a normal distribution. These characteristics include:
- Mode: The mode is the most frequently occurring value in the distribution.
- Median: The median is the value that divides the distribution into two equal halves.
- Range: The range is the difference between the highest and lowest values in the distribution.
- Interquartile range (IQR): The IQR is the difference between the 75th percentile and the 25th percentile of the distribution.
- Variance: The variance is a measure of how spread out the distribution is.
- Standard deviation: The standard deviation is the square root of the variance.
All of these statistical characteristics can be used to describe the normal distribution and to compare different normal distributions.
By understanding the factors that completely determine a normal distribution, the key parameters that influence the shape of the distribution, and the statistical characteristics that define a normal distribution, we can better understand and use this important statistical concept.


