What is a random graph?
A random graph is a mathematical model used to describe a network or graph where edges between nodes are added with a certain probability according to a random process. In other words, it's a way to generate graphs or networks in a probabilistic manner. Random graphs are widely used in various fields, including mathematics, computer science, social science, and biology, to study and model various real-world phenomena. There are different models and concepts related to random graphs, including the Erdős-Rényi model, Watts-Strogatz model, and Barabási-Albert model, each with its own characteristics and applications.
Here are some key concepts and characteristics associated with random graphs:
Erdős-Rényi (ER) Model: The Erdős-Rényi model, named after mathematicians Paul Erdős and Alfréd Rényi, is one of the most fundamental random graph models. In this model, you start with a fixed number of nodes (vertices), and edges (connections) between these nodes are added randomly with a fixed probability p. The properties of ER graphs can vary significantly depending on the value of p. When p is low, the graph may consist of isolated nodes or small components, while when p is high, the graph is more likely to be connected.
Connectedness: One of the key characteristics of random graphs is their connectedness. Depending on the model and parameters, random graphs may exhibit different levels of connectedness. In the ER model, there is a critical probability value (usually denoted as pc) at which the graph undergoes a phase transition from being mostly disconnected to mostly connected.
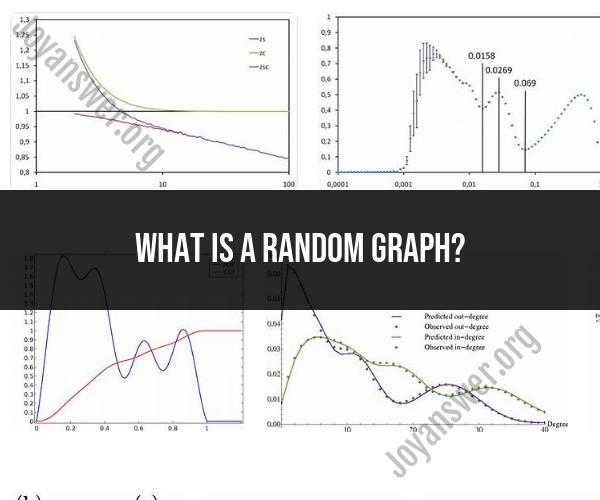
Degree Distribution: The degree of a node in a graph is the number of edges incident to that node. In random graphs, the degree distribution can be analyzed. For example, in the ER model, the degree distribution follows a binomial distribution. In contrast, other random graph models, like the Barabási-Albert model, exhibit a scale-free degree distribution, which means that a few nodes have a very high degree while most nodes have a low degree.
Small-World Phenomenon: The Watts-Strogatz model is a random graph model that exhibits the small-world phenomenon. This means that even though the graph is mostly random, it has a high clustering coefficient (nodes tend to be connected to their neighbors) and short average path lengths between nodes. This is often used to model social networks and other networks with both local and global connectivity.
Community Structure: Random graphs can also be used to study the emergence of community structures within networks. Communities are groups of nodes that are more densely connected to each other than to nodes outside the group. Detecting communities in random graphs or real-world networks is a common research topic.
Applications: Random graphs are used in various applications, such as modeling social networks, the spread of diseases, the structure of the World Wide Web, and more. They provide a framework for studying the behavior of networks under random conditions and understanding how network properties emerge.
Random graph theory provides valuable insights into the behavior of networks and helps researchers and scientists understand the characteristics and properties of complex systems represented as graphs or networks. It allows for the exploration of network connectivity, robustness, and emergent phenomena.
Understanding Random Graphs: Concepts and Applications
Concepts
A random graph is a graph in which the edges are chosen randomly. There are many different ways to generate random graphs, but the most common model is the Erdős-Rényi model. In the Erdős-Rényi model, each pair of vertices has a probability p of being connected by an edge.
Random graphs have a number of interesting properties. For example, the average degree of a vertex in a random graph is equal to pn, where n is the number of vertices in the graph. Additionally, the probability that a random graph contains a large clique (a complete subgraph) decreases exponentially with the size of the clique.
Applications
Random graphs have a wide variety of applications in many different fields, including computer science, mathematics, and physics. Some specific examples of applications of random graphs include:
- Modeling the structure of the Internet
- Studying the spread of diseases and other contagions
- Developing new algorithms for searching and sorting
- Understanding the behavior of complex systems, such as financial markets and social networks
Exploring the World of Random Graph Theory
Random graph theory is a branch of mathematics that studies the properties of random graphs. Random graph theory is a relatively young field, but it has already made a significant impact on our understanding of complex systems.
One of the most important results in random graph theory is the Erdős-Rényi theorem. This theorem states that for almost all random graphs, the giant component (the largest connected component) appears at a critical probability p. This means that for p slightly below the critical probability, the giant component is small, but for p slightly above the critical probability, the giant component is very large.
Another important result in random graph theory is the phase transition theorem. This theorem states that for almost all random graphs, there is a sharp transition from a sparse graph (a graph with few edges) to a dense graph (a graph with many edges). This transition occurs at the critical probability.
Randomness in Network Structures: Insights from Random Graphs
Random graphs can provide valuable insights into the structure and behavior of real-world networks. For example, random graphs can be used to study the following properties of real-world networks:
- The distribution of the number of connections per node
- The clustering coefficient (a measure of how tightly connected the nodes in a network are)
- The average path length (the average number of edges in the shortest path between two nodes in a network)
Random graphs can also be used to develop new algorithms for modeling and analyzing real-world networks. For example, random graphs can be used to develop algorithms for:
- Finding the most influential nodes in a network
- Identifying communities within a network
- Predicting the spread of infections and other contagions through a network
Overall, random graphs are a powerful tool for understanding and modeling real-world networks.
Here are some specific examples of how random graphs have been used to study real-world networks:
- Scientists have used random graphs to model the spread of the AIDS virus through the human population.
- Computer scientists have used random graphs to develop new algorithms for searching and sorting large datasets.
- Economists have used random graphs to model the structure of financial markets.
- Physicists have used random graphs to model the behavior of complex systems, such as the Internet and social networks.
Random graph theory is a rapidly growing field with many new and exciting applications. As our understanding of random graphs continues to grow, we can expect to see even more applications of random graphs to real-world problems.