What are some examples of discrete and continuous variables?
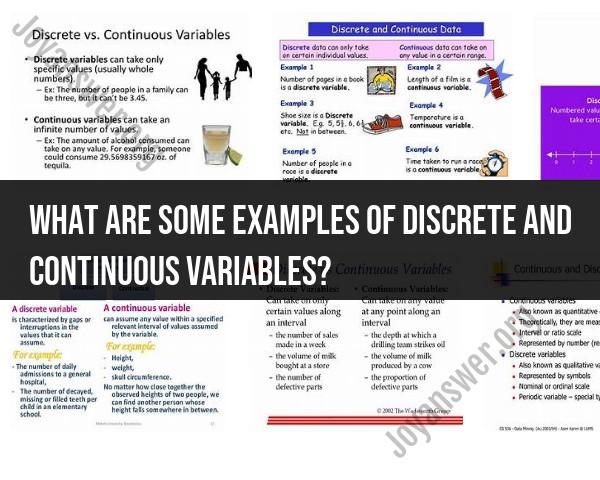
Discrete and continuous variables are two different types of data in statistics. Here are examples of each and the distinctions between them:
Discrete Variables:
Number of Students in a Classroom: The count of students in a classroom is a discrete variable because it can only take on specific whole number values (e.g., 25 students, 26 students, 27 students).
Number of Cars in a Parking Lot: Similarly, the number of cars in a parking lot is discrete because it can only be a whole number (e.g., 50 cars, 51 cars, 52 cars).
Number of Children in a Family: The count of children in a family is also a discrete variable, taking on integer values (e.g., 1 child, 2 children, 3 children).
Number of Books on a Shelf: The number of books on a shelf is a discrete variable because it cannot be a fractional or continuous value (e.g., 10 books, 11 books, 12 books).
Number of Customer Complaints: In a customer service context, the number of complaints received in a day is a discrete variable.
Continuous Variables:
Height of Individuals: Height is a continuous variable because it can take on any value within a range, and there are infinite possible measurements within that range (e.g., 165.3 cm, 175.6 cm, 180.0 cm).
Weight of Objects: The weight of an object is a continuous variable because it can take on any value within a certain range (e.g., 2.5 kg, 3.0 kg, 3.75 kg).
Temperature: Temperature is a classic example of a continuous variable. It can be measured with precision, and there are an infinite number of temperature values within a range (e.g., 20.5°C, 21.0°C, 21.5°C).
Time: Time is a continuous variable. It can be measured with great precision and can take on any value within a continuous time scale (e.g., 2:30:15 PM, 2:30:16 PM).
Distance Traveled: The distance traveled by an object or a person is continuous because it can take on any non-negative value, including decimal fractions (e.g., 5.7 miles, 6.3 miles, 7.0 miles).
Distinctions:
Countable vs. Measurable: Discrete variables represent countable items, while continuous variables represent measurable quantities.
Whole Numbers vs. Infinite Values: Discrete variables take on whole numbers or specific, distinct values, whereas continuous variables can have an infinite number of possible values within a given range.
Quantization: Discrete variables are quantized, meaning they have gaps between possible values. Continuous variables, on the other hand, can take on any value within a range.
Examples of Measurements: Discrete variables are often related to counts (e.g., number of items, number of people), while continuous variables are typically related to measurements (e.g., height, weight, temperature).
Understanding the distinction between discrete and continuous variables is crucial in statistical analysis, as it affects the choice of statistical methods and tools used to analyze data.
Can you provide examples of discrete variables in mathematics and statistics?
Sure, here are some examples of discrete variables in mathematics and statistics:
- Number of students in a class
- Number of siblings a person has
- Number of cars that pass by an intersection in a minute
- Number of defects in a product
- Number of heads in 10 flips of a fair coin
- Outcome of a die roll
- Score on a test
- Shoe size
- Eye color
- Zip code
- Day of the week
- Month of the year
- Country of birth
What distinguishes discrete variables from continuous ones, and how are they used?
Discrete variables are variables that can only take on a certain set of values. Continuous variables, on the other hand, are variables that can take on any value within a range.
Discrete variables are often used to count or categorize things. For example, the number of students in a class is a discrete variable because it can only take on integer values. The weight of a student, on the other hand, is a continuous variable because it can take on any value within a range.
Discrete variables are also used to model probabilities. For example, the probability of flipping a heads on a coin is a discrete probability because it can only take on the values 0 or 1.
How do you identify discrete variables in data sets or mathematical problems?
To identify discrete variables in data sets or mathematical problems, you can look for the following characteristics:
- The variable can only take on a certain set of values.
- The variable is often used to count or categorize things.
- The variable is often used to model probabilities.
For example, if you are given a data set that shows the number of students in each class at a school, you can identify this variable as discrete because it can only take on integer values.
What are some real-world scenarios where discrete variables play a significant role?
Discrete variables play a significant role in many real-world scenarios. For example, discrete variables are used to:
- Predict the number of customers a business will have on a given day.
- Determine the number of employees needed to staff a factory.
- Estimate the number of people who will vote in an election.
- Assess the risk of a patient developing a disease.
- Control the quality of manufactured products.
How to perform calculations or analysis with discrete data?
There are many different ways to perform calculations or analysis with discrete data. Some common methods include:
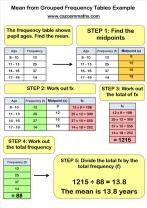
- Frequency tables: Frequency tables can be used to summarize the distribution of a discrete variable.
- Bar charts: Bar charts can be used to visualize the distribution of a discrete variable.
- Histograms: Histograms can be used to visualize the distribution of a continuous variable.
- Probability distributions: Probability distributions can be used to model the probabilities of different outcomes for a discrete variable.
- Statistical tests: Statistical tests can be used to test hypotheses about discrete variables.
The specific method that you use to perform calculations or analysis with discrete data will depend on the specific problem that you are trying to solve.
