What is a multiple regression analysis?
Multiple regression analysis is a statistical technique used to examine the relationship between a dependent variable and two or more independent variables. It extends the simple linear regression analysis, which involves the relationship between a dependent variable and a single independent variable, to a scenario where there are multiple predictors.
In multiple regression, the goal is to model the linear relationship between the dependent variable (often denoted as ) and multiple independent variables (often denoted as ). The general form of a multiple regression equation is as follows:
Here:
- is the dependent variable.
- are the independent variables.
- is the intercept (the value of when all independent variables are zero).
- are the coefficients (representing the change in for a one-unit change in each corresponding ).
- is the error term, representing unobserved factors that affect but are not included in the model.
The multiple regression analysis aims to estimate the coefficients () that minimize the sum of the squared differences between the observed and predicted values of the dependent variable. This is typically done using a method called the least squares estimation.
Key steps in performing multiple regression analysis include:
Data Collection: Gather data on the dependent variable and the multiple independent variables for each observation.
Model Specification: Define the form of the multiple regression equation by selecting the dependent and independent variables.
Parameter Estimation: Use statistical methods to estimate the coefficients of the regression equation.
Model Fit Assessment: Evaluate the overall fit of the model and the significance of each independent variable in explaining the variation in the dependent variable.
Prediction and Inference: Use the model to make predictions and draw inferences about the relationships between variables.
Multiple regression is widely used in various fields, including economics, finance, social sciences, and natural sciences, to analyze complex relationships among variables. It provides insights into how changes in one or more independent variables are associated with changes in the dependent variable, allowing researchers to make predictions and test hypotheses about the relationships within the data.
What steps are involved in conducting a multiple regression analysis?
The steps involved in conducting a multiple regression analysis are as follows:
- Identify the dependent and independent variables. The dependent variable is the variable you are trying to predict, while the independent variables are the variables you believe are influencing the dependent variable.
- Collect data. You need to collect a dataset that includes both the dependent and independent variables. The dataset should be as large as possible to ensure that the results are reliable.
- Prepare the data. This may involve cleaning the data and removing any outliers. You may also need to transform the data so that it meets the assumptions of multiple regression.
- Choose a regression model. There are different types of regression models, such as linear regression and logistic regression. Choose the model that is most appropriate for your data and research question.
- Fit the model to the data. This involves using a statistical software package to estimate the parameters of the regression model.
- Interpret the model results. The model results will tell you which independent variables are statistically significant and how they are related to the dependent variable.
- Evaluate the model. This involves checking to make sure that the model meets the assumptions of multiple regression and that it is a good fit for the data.
How is data interpreted in a multiple regression analysis?
The data in a multiple regression analysis is interpreted by looking at the coefficients of the independent variables. The coefficient of an independent variable represents the change in the dependent variable that is associated with a one-unit change in the independent variable, holding all other independent variables constant.
For example, if the coefficient of an independent variable is 0.5, this means that a one-unit increase in the independent variable is associated with a 0.5-unit increase in the dependent variable. The p-value of the coefficient tells you whether the relationship between the independent and dependent variables is statistically significant.
In addition to the coefficients, you should also look at the R-squared value of the model. The R-squared value is a measure of how well the model fits the data. It ranges from 0 to 1, with higher values indicating a better fit.
Are there common pitfalls in multiple regression analysis and how to avoid them?
Yes, there are a few common pitfalls in multiple regression analysis. These include:
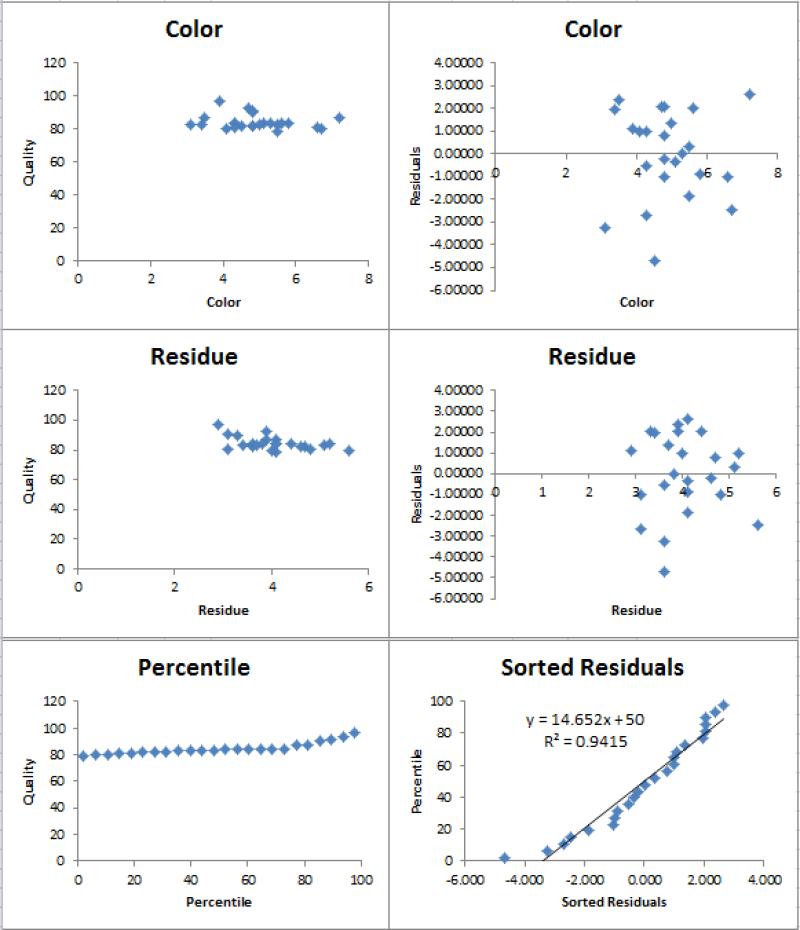
- Multicollinearity: This occurs when two or more independent variables are highly correlated with each other. Multicollinearity can make it difficult to interpret the results of the regression model. To avoid multicollinearity, you should check the correlation matrix of the independent variables before running the regression model.
- Overfitting: This occurs when the model fits the training data too well and does not generalize well to new data. To avoid overfitting, you should use a validation set to evaluate the model and choose a model with a high R-squared value on the validation set.
- Omitted variable bias: This occurs when you omit an important independent variable from the regression model. Omitted variable bias can lead to inaccurate results. To avoid omitted variable bias, you should carefully consider all of the variables that may be influencing the dependent variable.
Here are some additional tips for avoiding common pitfalls in multiple regression analysis:
- Use a large dataset. A larger dataset will help to ensure that the results are reliable and that the model is not overfitting the data.
- Transform the data. If the data does not meet the assumptions of multiple regression, you may need to transform it. For example, you may need to log-transform the data or square the data.
- Use a validation set. A validation set is a subset of the data that is not used to fit the model. It is used to evaluate the model and choose a model that is not overfitting the data.
- Interpret the results carefully. Keep in mind that the regression model is just a statistical tool. It cannot tell you that one variable causes another variable. It can only tell you that there is a statistical relationship between the two variables.
Overall, multiple regression analysis is a powerful tool for analyzing data and identifying relationships between variables. However, it is important to be aware of the common pitfalls and to take steps to avoid them.