How do you interpret the z score?
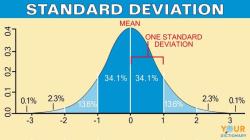
The Z-score is a statistical measure commonly used to assess the relative position of data points within a normal distribution. It provides a standardized score that helps us understand the significance and implications of data. Here's how to interpret the Z-score and its significance and implications:
1. Calculating the Z-Score:
- The Z-score is calculated by subtracting the mean of the distribution from the data point and then dividing by the standard deviation.
- Formula:
- Here, Z is the Z-score, X is the data point, μ (mu) is the mean of the distribution, and σ (sigma) is the standard deviation of the distribution.
2. Interpreting the Z-Score:
- A positive Z-score (Z > 0) indicates that the data point is above the mean of the distribution.
- A negative Z-score (Z < 0) indicates that the data point is below the mean of the distribution.
- Z = 0 indicates that the data point is equal to the mean of the distribution.
3. Significance of the Z-Score:
- The Z-score tells us the relative position of a data point within the distribution. If the Z-score is significantly high or low, it may indicate the importance of that data point.
- Z-scores are useful for identifying outliers. If the Z-score is far from zero, it suggests that the data point is noticeably different from other data points in the distribution.
4. Implications of the Z-Score:
- A high Z-score may imply that the data point is relatively distant within the distribution, suggesting it may be an outlier or statistically significant.
- A low Z-score suggests that the data point is close to the mean and may not be particularly noteworthy.
- High Z-scores can also be used to determine the cumulative probability of a data point within a normal distribution.
5. Applications in Statistical Inference:
- Z-scores are highly useful in statistical inference. They are used to calculate confidence intervals, perform hypothesis testing, and assess effect sizes.
- Hypothesis testing often involves comparing sample statistics to population parameters using Z-scores.
6. Real-World Applications:
- Z-scores find wide applications in various fields, including financial analysis, medical research, quality control, and market research.
- For example, in finance, Z-scores can be used to assess the risk of investment portfolios.
In summary, the Z-score is a valuable tool for understanding the relative position and significance of data. By calculating and interpreting Z-scores, we can gain better insights into the statistical properties of data and make more informed decisions in various applications.


