How to conduct hypothesis test in statistics?
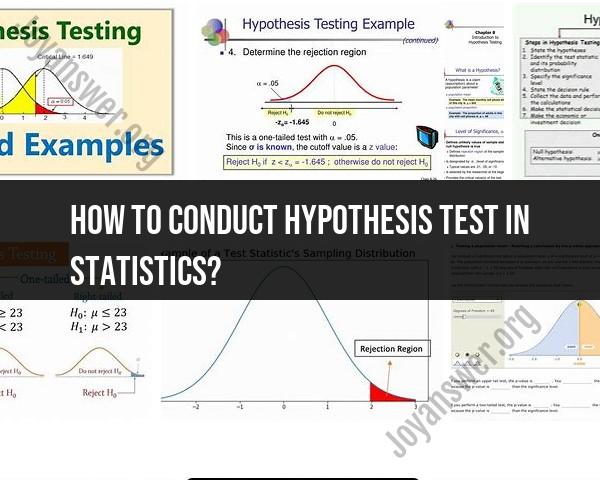
Conducting a hypothesis test in statistics involves a series of steps to determine if there's enough evidence to support or reject a statistical hypothesis. Here's a step-by-step guide on how to conduct a hypothesis test:
Step 1: State the Hypotheses
- Start by stating your null hypothesis () and your alternative hypothesis ( or ). The null hypothesis is the statement you want to test, and the alternative hypothesis represents the claim you want to support.
Step 2: Set the Significance Level ()
- Choose a significance level, denoted by , which is the probability of making a Type I error (rejecting a true null hypothesis). Common significance levels include 0.05 (5%) and 0.01 (1%).
Step 3: Collect Data
- Collect a sample of data that is relevant to the hypothesis being tested. The sample size and data collection method depend on the specific problem.
Step 4: Perform the Test
- Use an appropriate statistical test based on the type of data and hypothesis being tested. Common tests include the t-test, chi-squared test, ANOVA, and z-test. The choice of test depends on the nature of your data and the hypotheses.
Step 5: Calculate the Test Statistic
- Compute the test statistic using the formula relevant to your chosen statistical test. The test statistic represents the difference between the sample data and what is expected under the null hypothesis.
Step 6: Find the P-Value
- Determine the p-value, which is the probability of obtaining the observed test statistic (or more extreme results) if the null hypothesis is true. The p-value provides a measure of evidence against the null hypothesis.
Step 7: Make a Decision
- Compare the p-value to the significance level () you set in Step 2:
- If , reject the null hypothesis. You have enough evidence to support the alternative hypothesis.
- If , fail to reject the null hypothesis. There is not enough evidence to support the alternative hypothesis.
Step 8: Draw a Conclusion
- Based on the decision in Step 7, draw a conclusion regarding the hypothesis test. If you rejected the null hypothesis, state the results in the context of your problem.
Step 9: Report Your Findings
- Provide a clear and concise summary of your hypothesis test, including the test statistic, p-value, decision, and conclusion. Present the results in a manner that can be understood by your intended audience.
Step 10: Interpret the Results
- Interpret the results in the context of your research question. What do the findings mean, and how do they address your original hypothesis?
Remember that hypothesis testing is a fundamental process in statistics, and it's important to choose the appropriate test, set the significance level carefully, and ensure the data is collected and analyzed correctly. Additionally, the interpretation of results should be based on statistical evidence and the context of the problem being studied.
A Step-by-Step Guide to Conducting a Hypothesis Test in Statistics
Hypothesis testing is a statistical method used to determine whether there is enough evidence to support a particular claim. It is a widely used method in science and engineering, and it can be used to answer a variety of questions, such as:
- Is a new drug more effective than a placebo?
- Is there a relationship between two variables?
- Is a population mean different from a hypothesized value?
To conduct a hypothesis test, you will need to follow these steps:
- State your null and alternative hypotheses. The null hypothesis is the hypothesis that you are trying to disprove. The alternative hypothesis is the hypothesis that you are trying to support.
- Collect data. You will need to collect data that is relevant to your hypothesis. This data can be collected from a variety of sources, such as surveys, experiments, or observational studies.
- Choose a statistical test. There are many different statistical tests that can be used for hypothesis testing. The choice of test will depend on the type of data that you have collected and the type of hypothesis that you are testing.
- Calculate the p-value. The p-value is the probability of obtaining the results that you observed or more extreme, assuming that the null hypothesis is true.
- Interpret the p-value. If the p-value is less than a certain threshold (typically 0.05), then you reject the null hypothesis and conclude that the alternative hypothesis is true. Otherwise, you fail to reject the null hypothesis.
Understanding Hypothesis Testing: Basics and Principles
Hypothesis testing is based on the following principles:
- Random sampling: The data that is collected for the hypothesis test should be collected using random sampling. This ensures that the data is representative of the population that you are interested in.
- Test statistic: The test statistic is a statistic that is calculated from the sample data. It is used to measure how far the sample data is from the hypothesized value.
- P-value: The p-value is the probability of obtaining the test statistic that you observed or more extreme, assuming that the null hypothesis is true.
Types of Hypothesis Tests: Choosing the Right Approach
There are many different types of hypothesis tests. The choice of test will depend on the type of data that you have collected and the type of hypothesis that you are testing.
Here are some examples of common hypothesis tests:
- T-test: The t-test is used to compare two population means.
- Z-test: The z-test is a special case of the t-test that is used when the population standard deviation is known.
- Chi-squared test: The chi-squared test is used to test for associations between two categorical variables.
- ANOVA: ANOVA is used to compare three or more population means.
Interpreting Hypothesis Test Results: Statistical Significance
The p-value is used to interpret the results of a hypothesis test. If the p-value is less than a certain threshold (typically 0.05), then you reject the null hypothesis and conclude that the alternative hypothesis is true. Otherwise, you fail to reject the null hypothesis.
It is important to note that a statistically significant result does not necessarily mean that the alternative hypothesis is true. It is possible to have a statistically significant result even if the null hypothesis is true. This is known as a type I error.
Common Pitfalls in Hypothesis Testing and How to Avoid Them
Here are some common pitfalls in hypothesis testing and how to avoid them:
- Failing to state the null and alternative hypotheses correctly: The null and alternative hypotheses should be clearly stated before you collect any data.
- Choosing the wrong statistical test: The choice of statistical test will depend on the type of data that you have collected and the type of hypothesis that you are testing.
- Misinterpreting the p-value: The p-value should not be interpreted as the probability of the alternative hypothesis being true. It is simply the probability of obtaining the test statistic that you observed or more extreme, assuming that the null hypothesis is true.
- Not considering the sample size: The sample size can affect the outcome of a hypothesis test. A larger sample size is generally more likely to produce a statistically significant result.
By following these tips, you can avoid common pitfalls in hypothesis testing and increase the reliability of your results.
