Home » Technology » Unveiling Mean Deviation Calculation in Excel: A Comprehensive Guide

Unveiling Mean Deviation Calculation in Excel: A Comprehensive Guide

August 14, 2023 by JoyAnswer.org, Category : Technology

How do you calculate mean deviation in Excel? Dive into the world of data analysis with Excel as we demystify the process of calculating mean deviation. Discover how to effectively measure the spread of data points around the mean using Excel's functions and unleash the power of statistical insights.


Unveiling Mean Deviation Calculation in Excel: A Comprehensive Guide

How do you calculate mean deviation in Excel?

Mean Deviation, also known as Mean Absolute Deviation (MAD), is a statistical measure used to quantify the average distance between each data point in a dataset and the mean (average) of the dataset. It provides insights into the spread or dispersion of data points around the mean. Here's a comprehensive guide on how to calculate Mean Deviation in Excel:

Step-by-Step Guide:

  1. Data Preparation:Arrange your data in a column in an Excel worksheet.

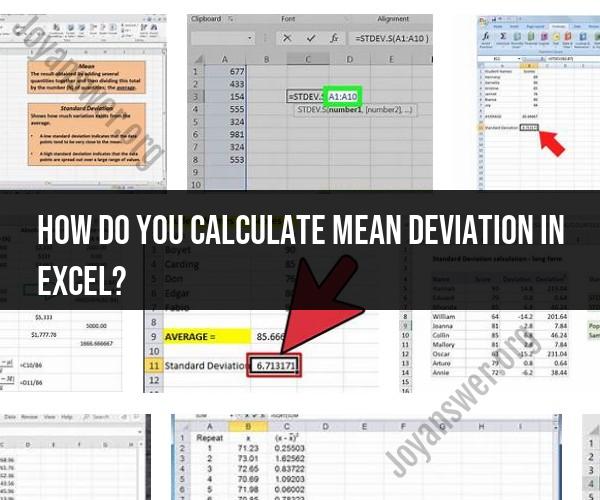
  2. Calculate the Mean (Average):In a cell, use the AVERAGE function to calculate the mean of the data. For example, if your data is in column A from A1 to A10, you would use:

    =AVERAGE(A1:A10)
    
  3. Calculate Absolute Deviations:In the next column, calculate the absolute deviations for each data point by subtracting the mean from each data point and taking the absolute value. Use the ABS function. For example, if your mean is in cell B1 and your data is in column A from A1 to A10, you would use the following formula in cell C1 and then copy it down to C10:

    =ABS(A1-B1)
    
  4. Calculate Mean Deviation:After calculating the absolute deviations in column C, use the AVERAGE function to calculate the mean of the absolute deviations. For example, if your absolute deviations are in column C from C1 to C10, you would use:

    =AVERAGE(C1:C10)
    

Excel Example:Let's say your data is in cells A1 to A10, and you want to calculate the Mean Deviation:

Data Mean Deviation
10  
15  
12  
18  
20  
8  
14  
16  
11  
9  

In cell B1, calculate the mean:

=B1 = AVERAGE(A1:A10)

In column C, calculate the absolute deviations:

C1 = ABS(A1-B1)
C2 = ABS(A2-B1)
...

In cell D1, calculate the Mean Deviation:

=D1 = AVERAGE(C1:C10)

Interpretation:The Mean Deviation gives you an idea of the average distance of data points from the mean. A lower Mean Deviation indicates that data points are closer to the mean, while a higher Mean Deviation suggests greater variability.

Remember that while Mean Deviation is a useful measure of dispersion, it doesn't take into account the squared differences like the more commonly used Standard Deviation does. Depending on your analysis needs, you might choose to use either Mean Deviation or Standard Deviation.

Tags Mean Deviation Calculation , Excel Data Analysis , Statistical Measures

People also ask

  • What is a one variable data table?

    One Variable Data Table One Variable Data Table Show the Possible Outcomes as you Vary a Single Data Cell Structure of a One Variable Data Table Structure of One Variable Data Table This is the formula (or a link to the formula) that returns the results you are after.
    Learn about one-variable data tables in Excel and how they are used to perform sensitivity analysis and explore different scenarios based on a single input variable. ...Continue reading

  • What are the merits and demerits of mean median and mode?

    Merits and Demerits of median & mode (1) Simplicity:- It is very simple measure of the central tendency of the series. ... (2) Free from the effect of extreme values: - Unlike arithmetic mean, median value is not destroyed by the extreme values of the series. (3) Certainty: - Certainty is another merits is the median. ... More items...
    Understand the advantages and disadvantages of using mean, median, and mode as statistical measures. This article provides insights into the merits and demerits of these methods. ...Continue reading

  • What does the variance and standard deviation tell us?

    Variance tells you the degree of spread in your data set. The more spread the data, the larger the variance is in relation to the mean. With allowance for this, what does the standard deviation tell us? The standard deviation is the average amount of variability in your data set. It tells you, on average, how far each score lies from the mean.
    Learn what variance and standard deviation tell us in statistical analysis. This guide provides insights into the interpretation and significance of these measures in assessing data dispersion. ...Continue reading

The article link is https://joyanswer.org/unveiling-mean-deviation-calculation-in-excel-a-comprehensive-guide, and reproduction or copying is strictly prohibited.