What is a one variable data table?
A one-variable data table is a powerful feature in Microsoft Excel that allows you to explore how a single input variable or a set of input values affect the result of a formula or function in a spreadsheet. It's a valuable tool for performing sensitivity analysis and "what-if" scenarios.
Here's how a one-variable data table works and why it's useful:
Structure of a One-Variable Data Table:
- A one-variable data table consists of a grid or table within an Excel worksheet.
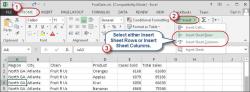
- The table has two primary areas: the "Row Input Cell" and the "Column Input Cell."
- The "Row Input Cell" is a reference to a cell or formula in your worksheet that represents the variable you want to change or test.
- The "Column Input Cell" is a reference to a cell or formula that contains different values or scenarios you want to test for the variable defined in the "Row Input Cell."
- The table calculates and displays the result of a formula or function for each value specified in the "Column Input Cell."
Purpose of a One-Variable Data Table:
- Sensitivity Analysis: You can use a one-variable data table to analyze how changes in a specific input variable impact the final outcome of a formula. For example, you might want to see how different interest rates affect the monthly mortgage payment for a loan.
- What-If Scenarios: It allows you to quickly evaluate various scenarios by changing a single variable while keeping other factors constant. This is helpful for decision-making and forecasting.
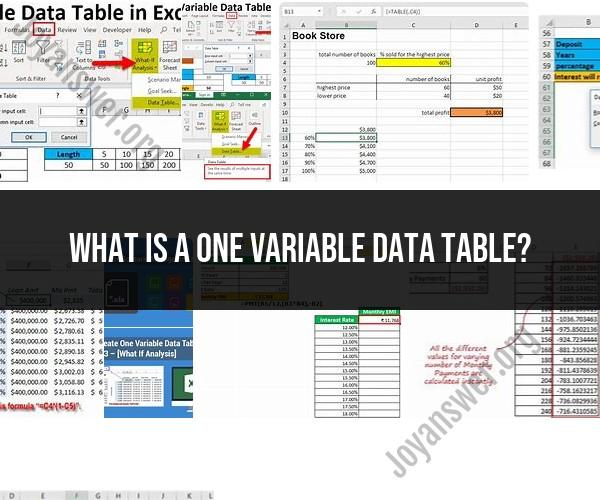
Example Usage:Suppose you want to determine how changes in the interest rate affect the monthly payment for a fixed-rate mortgage. You have a formula that calculates the monthly payment based on the interest rate. You can set up a one-variable data table to see how different interest rates (ranging from 3% to 6%) impact the monthly payment.
Here's how to create a one-variable data table for this scenario:
In your worksheet, set up a cell (e.g., A1) for the "Row Input Cell" where you'll enter the different interest rates (e.g., 3%, 4%, 5%, 6%).
In a nearby cell (e.g., B1), enter the formula that calculates the monthly payment based on the interest rate. For example, you might use the
PMTfunction.Select a range of cells (e.g., A1:A5) where you entered the interest rates.
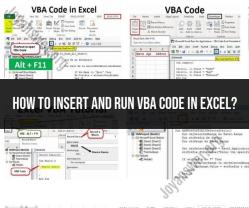
Go to the "Data" tab in Excel, click on "What-If Analysis" in the "Data Tools" group, and select "Data Table."
In the "Data Table" dialog box, enter the cell reference of the "Row Input Cell" (e.g., A1) as the "Row input cell."
Click "OK," and Excel will automatically populate the table with the calculated monthly payments for each interest rate.
The resulting one-variable data table will show you how different interest rates impact the monthly payment, allowing you to make informed decisions or explore various scenarios quickly.
In summary, a one-variable data table in Excel is a tool that helps you analyze and visualize how changes in a single input variable affect the results of a formula or function. It's particularly useful for performing sensitivity analysis and exploring different scenarios in financial, scientific, and business modeling.
One-Variable Data Tables: Unraveling the Concept
A one-variable data table in Excel is a table that shows how the output of a formula changes when the value of a single input variable is changed. It is a powerful tool for analyzing scenarios and making predictions.
To create a one-variable data table, you need to:
- Identify the input variable.
- Create a table with two columns: one for the input variable and one for the output of the formula.
- Enter the input values in the input column.
- Enter the formula in the output column for the first row.
- Select the entire table and click on the Data tab.
- In the Data Tools group, click on What-If Analysis and then Data Table.
- In the Data Table dialog box, enter the cell reference for the input variable in the Column Input Cell field.
- Click OK.
Excel will then calculate the output of the formula for each input value and create the data table.
Analyzing Scenarios with Excel: The Function of One-Variable Data Tables
One-variable data tables can be used to analyze a variety of scenarios. For example, you can use a one-variable data table to:
- See how the total sales of a product change when the price is changed.
- See how the monthly mortgage payment changes when the interest rate is changed.
- See how the number of days it takes to reach a financial goal changes when the amount saved each month is changed.
Excel's Data Table Feature: A Closer Look at One-Variable Tables
Here are some additional things to keep in mind about one-variable data tables in Excel:
- One-variable data tables can only be used with formulas that have a single input variable.
- The input variable must be a number.
- The output of the formula can be a number, a text string, or a logical value.
- One-variable data tables can be used with formulas that contain other functions.
- One-variable data tables can be used to analyze scenarios with multiple input variables. To do this, you can use a nested data table.
One-variable data tables are a powerful tool for analyzing scenarios and making predictions. If you are working with data in Excel, I encourage you to learn how to use one-variable data tables.