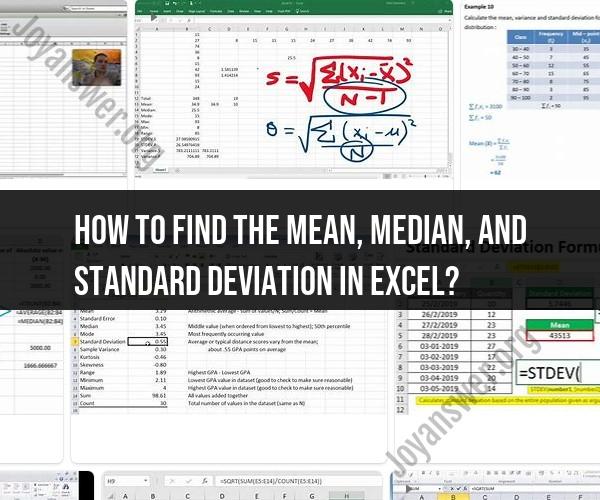
How to find the mean, median, and standard deviation in Excel?
Excel is a powerful tool not only for data management but also for statistical analysis. This article delves into mastering some of Excel's essential statistical tools: calculating the mean, median, and standard deviation. These tools enable you to uncover insights and trends within your data, making your analysis more informed and effective.
Introduction to Statistical Analysis in Excel
Statistical analysis involves interpreting data to discover patterns, trends, and relationships. Excel's built-in functions make performing these analyses seamless and efficient.
The Significance of Mean, Median, and Standard Deviation
Mean, median, and standard deviation are fundamental statistical measures that provide insights into the central tendency and variability of your data.
1. Mean
The mean, also known as the average, is the sum of all values divided by the total number of values. It represents the central value around which data points cluster.
2. Median
The median is the middle value in a dataset when it is arranged in ascending or descending order. It offers a robust measure of central tendency, especially in datasets with outliers.
3. Standard Deviation
The standard deviation measures the dispersion or spread of data points from the mean. A higher standard deviation indicates greater variability.
Mastering Mean, Median, and Standard Deviation in Excel
1. Calculating the Mean
Use the AVERAGE function in Excel to calculate the mean of a range of values. For example, =AVERAGE(A1:A10) calculates the mean of values in cells A1 to A10.
2. Finding the Median
The MEDIAN function computes the median of a dataset. For instance, =MEDIAN(B1:B20) finds the median of values in cells B1 to B20.
3. Determining Standard Deviation
Use the STDEV function to calculate the standard deviation of a dataset. For instance, =STDEV(C1:C15) calculates the standard deviation of values in cells C1 to C15.
Benefits of Excel's Statistical Tools
1. Data Insight
Calculating mean, median, and standard deviation helps you understand the distribution and characteristics of your data.
2. Data Validation
These tools enable you to identify outliers or data points that deviate significantly from the norm.
3. Informed Decision-Making
Statistical analysis equips you with valuable insights that drive more informed decisions and actions.
Conclusion
Mastering Excel's statistical tools, including mean, median, and standard deviation, empowers you to extract meaningful insights from your data. Whether you're analyzing financial trends, scientific experiments, or business performance, these tools are essential for unveiling patterns and making data-driven decisions. With Excel's user-friendly functions, you can effortlessly harness the power of statistics to enhance your data analysis skills.