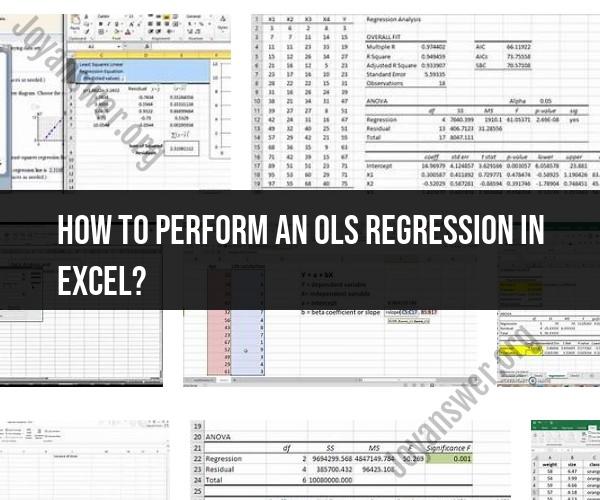
How to perform an OLS regression in Excel?
Performing Ordinary Least Squares (OLS) regression in Excel involves using the built-in tools for data analysis and regression. Here's a step-by-step guide:
Step 1: Prepare Your Data
- Organize your data in Excel, with the dependent variable (Y) in one column and the independent variable(s) (X) in another column(s). Ensure each row represents a data point.
Step 2: Open Excel and Load Data
- Open Microsoft Excel and load your dataset. You can do this by clicking on "File" > "Open" and selecting your file or copying and pasting the data into a new Excel worksheet.
Step 3: Activate Data Analysis ToolPak
- If you haven't already activated the Data Analysis ToolPak, you need to do this:
- Click on "File" > "Options."
- In the Excel Options dialog box, select "Add-Ins" from the left-hand menu.
- In the Add-Ins window, select "Excel Add-Ins" in the Manage box, and click "Go."
- Check the box next to "Analysis ToolPak" and click "OK."
Step 4: Perform OLS Regression
- With your data loaded and the ToolPak activated, follow these steps:
- Click on the "Data" tab in the Excel ribbon.
- Look for the "Analysis" group, and you should now see "Data Analysis" as an option. Click on it.
Step 5: Choose "Regression"
- In the Data Analysis dialog box that appears, scroll down to find "Regression" and select it. Click "OK."
Step 6: Configure the Regression Analysis Dialog Box
- In the Regression dialog box:
- Enter your dependent variable (Y) range in the "Input Y Range" field.
- Enter your independent variable(s) (X) range(s) in the "Input X Range" field.
- If you have multiple independent variables, make sure they are all listed.
- Choose an output location where you want the results to appear.
Step 7: Configure Options (Optional)
- If needed, you can configure additional options like confidence levels, labels, and residuals. These are optional settings depending on your analysis requirements.
Step 8: Run the Regression Analysis
- Click "OK" to run the regression analysis. Excel will generate a regression output report in the specified location, which includes regression coefficients, standard errors, R-squared, F-statistic, and other relevant statistics.
Step 9: Interpret the Results
- Review the regression output to interpret the results and assess the relationship between your dependent and independent variables.
Please note that Excel's built-in regression tool provides basic functionality. For advanced statistical analysis or more complex regression models, you may need to consider using dedicated statistical software like R, Python with libraries like statsmodels or scikit-learn, or specialized statistical software packages like SPSS or SAS.