What are plots of residuals?
Plots of residuals are graphical representations used in statistics to assess the goodness of fit of a statistical model. Residuals are the differences between the observed values and the predicted values from a model. These plots help analysts and researchers identify patterns or trends in the residuals, which can provide insights into the appropriateness of the model.
Here are some common types of plots of residuals:
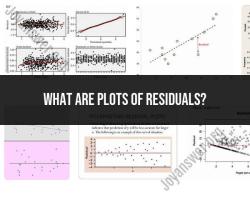
Residuals vs. Fitted Values (or Predicted Values) Plot:
- This plot shows the relationship between the predicted values from the model and the corresponding residuals. A horizontal band of points with no clear pattern suggests that the model is appropriate. Patterns or trends may indicate issues with the model, such as heteroscedasticity.
Normal Probability (Q-Q) Plot:
- The Q-Q plot compares the distribution of the residuals to a theoretical normal distribution. If the points in the Q-Q plot fall along a straight line, it indicates that the residuals are normally distributed. Deviations from the line may suggest non-normality.
Residuals vs. Independent Variable Plot:
- For regression models with multiple independent variables, separate plots of residuals against each independent variable can help identify relationships or patterns that the model may have missed.
Residuals vs. Time (for Time Series Data):
- In time series analysis, a plot of residuals against time can help identify patterns or trends over time that the model may not have captured.
Scale-Location (Spread-Location) Plot:
- This plot examines how the spread (or variance) of the residuals changes across the range of predicted values. A roughly constant spread suggests homoscedasticity, while a changing spread may indicate heteroscedasticity.
Residuals vs. Leverage Plot:
- This plot helps identify influential observations by combining information on residuals and leverage. Outliers with high leverage can have a disproportionate impact on the model.
Cook's Distance Plot:
- Cook's distance is a measure of the influence of each data point. A plot of Cook's distance helps identify influential observations that may significantly affect the model.
These plots are valuable tools for model diagnostics. They allow analysts to identify potential problems with the model assumptions, such as non-linearity, heteroscedasticity, outliers, or influential observations. Examining residuals can help refine models and improve their predictive accuracy.
What are the plots of residuals in statistical analysis?
Residual plots in statistical analysis are graphical representations of the residuals of a regression model. Residuals are the differences between the observed values of the dependent variable and the predicted values of the dependent variable, based on the regression model.
Residual plots can be used to assess the goodness of fit of a regression model and to identify potential problems with the model, such as non-linearity, outliers, and heteroscedasticity.
How are residual plots used to assess the goodness of fit in regression models?
A well-fitting regression model will have residuals that are randomly scattered around the zero line. This indicates that the model is able to explain the variation in the dependent variable reasonably well.
If the residuals exhibit a pattern, such as a non-linear trend, outliers, or heteroscedasticity, this indicates that the model is not fitting the data well.
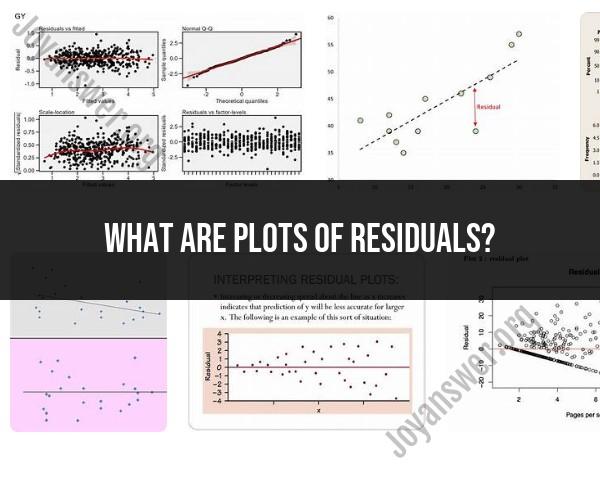
Can you provide examples of patterns in residual plots and their implications?
Here are some examples of patterns in residual plots and their implications:
- Non-linear trend: A non-linear trend in the residual plot indicates that the relationship between the independent and dependent variables is not linear. This means that the regression model is not appropriate for the data.
- Outliers: Outliers are points in the residual plot that are far away from the other points. Outliers can skew the results of the regression model and make it difficult to interpret.
- Heteroscedasticity: Heteroscedasticity is a condition in which the variance of the residuals is not constant across the range of the independent variables. This means that the regression model is not fitting the data well at all levels of the independent variables.
Examples:
- Non-linear trend: If you are fitting a linear regression model to data on the relationship between height and weight, and the residual plot shows a non-linear trend, this indicates that the relationship between height and weight is not linear. This means that the linear regression model is not appropriate for the data and you should consider using a different model, such as a polynomial regression model.
- Outliers: If you are fitting a linear regression model to data on the relationship between salary and experience, and the residual plot shows outliers, this indicates that there are some people in the data who have salaries that are much higher or lower than expected for their level of experience. These outliers could be due to factors such as bonuses, commissions, or job location. It is important to identify and address outliers before interpreting the results of the regression model.
- Heteroscedasticity: If you are fitting a linear regression model to data on the relationship between sales and advertising spending, and the residual plot shows heteroscedasticity, this indicates that the relationship between sales and advertising spending is not the same at all levels of advertising spending. This could be because the effect of advertising spending on sales is greater for smaller businesses than it is for larger businesses.
By examining residual plots, researchers can identify potential problems with their regression models and make necessary adjustments to improve the fit of the models.