What is residual plot?
A residual plot is a graphical representation used in statistics to assess the goodness of fit of a regression model. It helps to identify patterns, trends, or potential outliers in the residuals, which are the differences between observed values and the values predicted by the regression model.
Here's how a residual plot is typically created and interpreted:
Fit a Regression Model:
- Start by fitting a regression model to your data. This could be a linear regression, polynomial regression, or any other type of regression based on your analysis.
Calculate Residuals:
- Calculate the residuals by subtracting the predicted values from the actual observed values. The residual for each data point is .
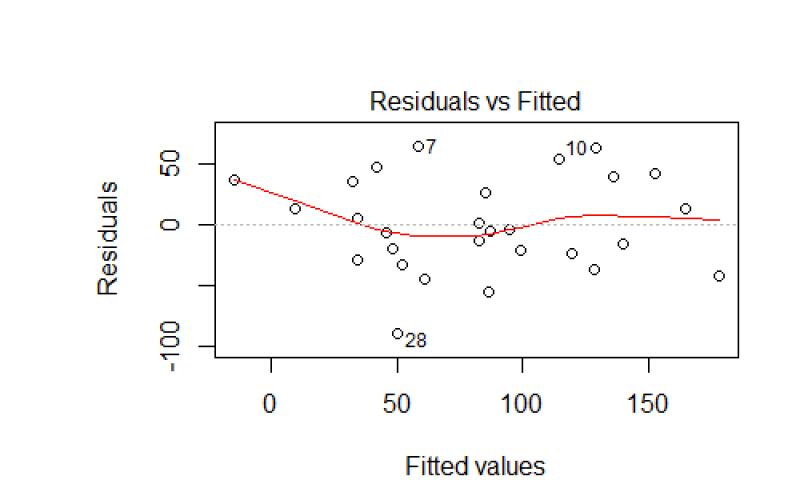
Create a Scatter Plot:
- Make a scatter plot with the independent variable (X-axis) and the residuals (Y-axis). Each point on the plot represents a data point from your dataset.
Add a Horizontal Line:
- Draw a horizontal line at . This represents the ideal scenario where residuals are exactly zero for all data points.
Interpret the Residual Plot:
- Examine the scatter plot for any patterns or trends. Common patterns include:
- Random Scatter: Residuals are scattered randomly around the horizontal line, indicating a good model fit.
- Systematic Patterns: Check for any systematic patterns, such as a curve or specific shape. This may indicate a lack of fit in the model.
- Examine the scatter plot for any patterns or trends. Common patterns include:
Check for Homoscedasticity:
- Ideally, the spread of residuals should be roughly constant across all levels of the independent variable. This is known as homoscedasticity. If the spread changes with the independent variable, it indicates heteroscedasticity, which may suggest issues with the model.
Identify Outliers:
- Outliers in the residuals can also be identified in the plot. These are data points where the model has difficulty making accurate predictions.
Residual plots are a valuable tool for diagnosing potential problems with regression models. They provide insights into the appropriateness of the model assumptions and can guide adjustments or improvements to the model. A well-fitted model should result in residuals that are randomly scattered around the horizontal line, indicating that the model captures the underlying patterns in the data.
Understanding residual plots and their significance in statistical analysis
Residual plots are a crucial tool in statistical analysis, providing valuable insights into the goodness-of-fit of a statistical model. They help evaluate how well a model captures the underlying relationship between the dependent and independent variables in the data.
What are Residuals?
Residuals represent the difference between the observed values of the dependent variable and the predicted values generated by the statistical model. They quantify the errors or deviations between the model's predictions and the actual data points.
Significance of Residual Plots
Residual plots offer several benefits in statistical analysis:
Assessing Model Fit: Residual plots provide a visual representation of the model's fit. A random scatter of residuals around zero indicates a well-fitting model, while systematic patterns or trends in the residuals suggest potential problems with the model's assumptions or its ability to capture the data accurately.
Identifying Outliers: Residual plots can help identify outliers or unusual data points that may distort the model's performance. Outliers can be investigated further to determine if they represent genuine data points or indicate errors or inconsistencies in the data collection process.
Evaluating Normality Assumption: If the statistical model assumes normally distributed residuals, residual plots can be used to check for normality using normality tests or quantile-quantile (QQ) plots.
Detecting Heteroscedasticity: Residual plots can reveal heteroscedasticity, which occurs when the variance of the residuals is not constant across the range of the independent variable. Heteroscedasticity can affect the validity of statistical inferences made from the model.
Diagnosing Autocorrelation: Residual plots can help identify autocorrelation, which occurs when residuals are correlated with each other. Autocorrelation can affect the efficiency of the model's parameter estimates.
Interpreting residual plots to assess model fit and identify outliers
Interpreting residual plots involves examining the distribution and patterns of the residuals.
Random Scatter: A well-fitting model should exhibit a random scatter of residuals around zero. This indicates that the model's predictions are unbiased and there is no systematic relationship between the residuals and the independent variables.
Constant Variance: The residuals should have constant variance, meaning their spread should not increase or decrease systematically with the predicted values or predictor variables. Heteroscedasticity, or non-constant variance, can affect the validity of statistical inferences.
Normality Check: If the model assumes normally distributed residuals, check for normality using normal probability plots or quantile-quantile (QQ) plots. A normal distribution of residuals supports the validity of statistical inferences based on the model.
Outlier Detection: Identify outliers in the residuals, which are data points that deviate significantly from the overall pattern. Investigate outliers to determine if they represent genuine data points or indicate errors or inconsistencies in the data collection process.
Pattern Analysis: Look for patterns or trends in the residuals. Increasing or decreasing trends may suggest that the model is missing important features or interactions. Curvilinear trends may indicate the need for a nonlinear transformation of the independent variable.
Creating residual plots using statistical software and tools
Most statistical software packages provide functions for generating residual plots. Here's a general workflow:
Import Data: Import the dataset into the statistical software.
Model Fitting: Fit the statistical model using the appropriate function.
Residual Calculation: Calculate the residuals by subtracting the predicted values from the corresponding observed values of the dependent variable.
Residual Plot Generation: Use the plotting function to create the residual plot. Customize the plot with labels, titles, axis scales, grid lines, and other graphical elements.
Utilizing residual plots to improve model performance and accuracy
Residual plots can guide the improvement of statistical models:
Addressing Heteroscedasticity: If heteroscedasticity is present, consider using weighted least squares regression or transforming the data to stabilize the variance.
Handling Autocorrelation: If autocorrelation is detected, use appropriate methods like autoregressive (AR) or moving average (MA) models to adjust for the correlation structure in the residuals.
Transforming Variables: If trends or patterns suggest nonlinear relationships, consider transforming the independent or dependent variable to capture the nonlinearity.
Adding/Removing Features: Based on residual patterns, consider adding relevant features or removing irrelevant features to improve the model's predictive power.
Selecting Appropriate Models: Compare residual plots of different models to identify the model that best captures the underlying relationships in the data.
Applications of Residual Plots in Various Fields
Residual plots have wide-ranging applications in various fields:
Regression Analysis: In linear regression, residual plots help assess the linearity assumption, constant variance, and normality of residuals.
Time Series Analysis: Residual plots are used in time series analysis to evaluate the adequacy of a model in capturing the trend,