What is the relationship between mean median and mode?
Mean, median, and mode are three measures of central tendency used in statistics to describe the center or typical value of a set of data. While they represent different aspects of a data set, there can be relationships and patterns among them. Here's an overview of their definitions and some insights into their relationships:
Mean:
The mean, often referred to as the average, is calculated by adding up all the values in a data set and dividing by the number of values.
Median:
The median is the middle value in a data set when the values are arranged in numerical order. If there is an even number of values, the median is the average of the two middle values.
Mode:
The mode is the value or values that occur most frequently in a data set.
Relationships:
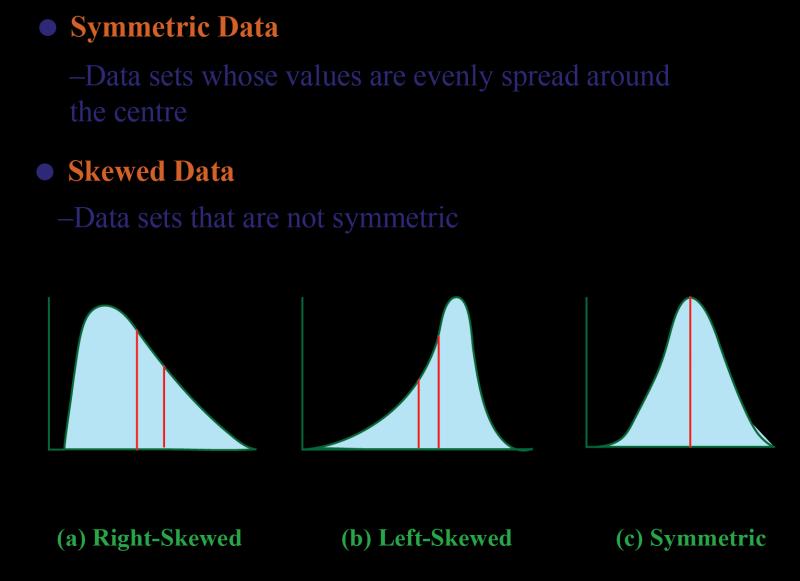
Symmetry and Skewness:
- In a perfectly symmetrical distribution (bell-shaped curve or normal distribution), the mean, median, and mode are all equal.
- In a skewed distribution (positively or negatively skewed), the mean is typically pulled in the direction of the skewness, while the median and mode may be different.
Mode and Skewness:
- In a positively skewed distribution (tail to the right), the mode is typically less than the median and mean.
- In a negatively skewed distribution (tail to the left), the mode is typically greater than the median and mean.
Outliers:
- The mean is sensitive to outliers (extreme values), and the presence of outliers can significantly affect the mean.
- The median is less affected by outliers, making it a more robust measure in the presence of extreme values.
- The mode is not as affected by outliers since it is based on frequency.
Bimodal or Multimodal Distributions:
- In bimodal or multimodal distributions (having two or more modes), the mean may not be a representative measure, and the median and mode(s) may provide a better description.
Measures of Central Tendency in Different Distributions:
- In normal distributions, mean = median = mode.
- In skewed distributions, mean is typically pulled in the direction of the skewness, and the median may be a more representative measure.
- In uniform distributions, where all values have the same frequency, any value can be considered a mode, and the mean and median are at the center.
Understanding the relationships among mean, median, and mode provides insights into the shape and characteristics of a distribution. While each measure has its strengths and weaknesses, considering all three provides a more comprehensive view of central tendency in a data set.
How do the mean, median, and mode relate to each other in statistical distributions?
The mean, median, and mode are central tendency measures that describe the "middle" of a statistical distribution. They offer different perspectives on the data and can be insightful depending on the specific distribution:
1. Mean:
- Represents the arithmetic average of all values in the data set.
- Sensitive to outliers, as extreme values can significantly impact the mean.
- Best suited for symmetrical distributions without skewness.
2. Median:
- Represents the "middle" value in a ranked data set, where half the values are above and half are below.
- Less sensitive to outliers than the mean.
- Suitable for both symmetrical and skewed distributions.
3. Mode:
- Represents the value that appears most frequently in the data set.
- Not affected by outliers.
- Can be informative for both unimodal and multimodal distributions (having multiple peaks).
Relationship between Mean, Median, and Mode:
- In normal distributions, the mean, median, and mode are all approximately equal. This signifies a symmetrical distribution with no skewness.
- In positively skewed distributions, the mean is greater than the median, which is greater than the mode. This indicates a long tail towards the right side of the distribution.
- In negatively skewed distributions, the mean is less than the median, which is less than the mode. This implies a long tail towards the left side of the distribution.
Empirical Relationship:
- In moderately skewed distributions, there exists an empirical relationship between the mean, median, and mode: Mode = 3 Median - 2 Mean. This formula provides a rough estimate of the mode based on the other two measures.
Choosing the appropriate measure:
- The choice between mean, median, and mode depends on the specific data and the desired information.
- If the data is normally distributed and not sensitive to outliers, the mean can be a good choice.
- If the data is skewed or contains outliers, the median might be a better option.
- The mode is helpful for identifying the most frequent value and is particularly useful for categorical data.
By understanding the relationship between these central tendency measures and their suitability for different distributions, researchers and analysts can effectively interpret and summarize statistical data.