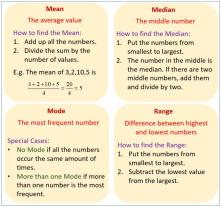
When is it best to use median, mean, and mode?
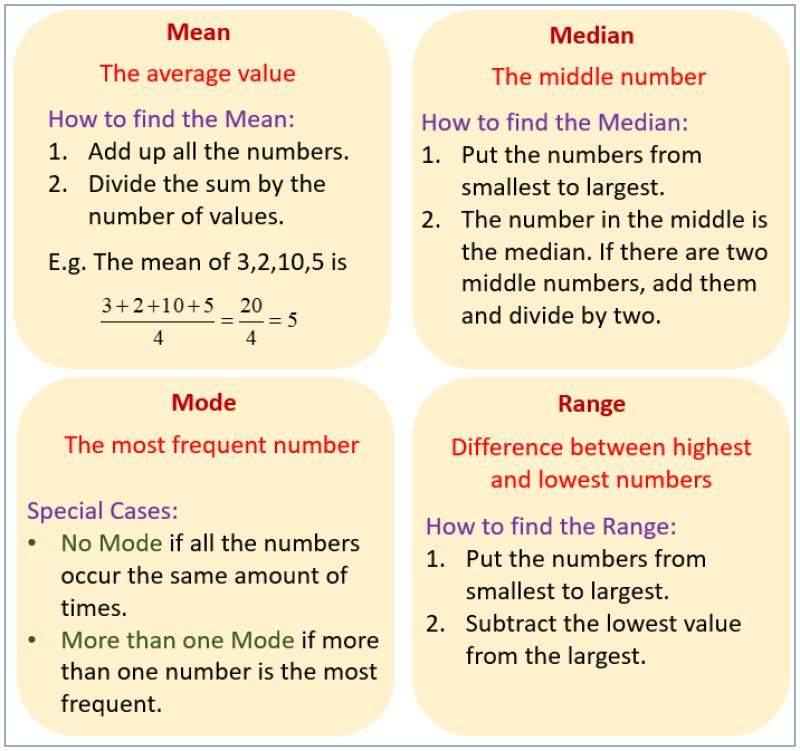
The choice between using the median, mean, or mode in statistics depends on the nature of the data and the specific goals of your analysis. Here's a general guide on when it's best to use each measure of central tendency:
Mean:
- Use Mean When: The data is roughly symmetrically distributed and does not have extreme outliers.
- Pros: It takes into account every value in the dataset, providing a comprehensive measure of central tendency.
- Cons: Susceptible to being influenced by extreme values (outliers), especially in skewed distributions.
Example: Calculating the mean income of a group of people.
Median:
- Use Median When: Dealing with skewed distributions, outliers, or ordinal data. It is robust against extreme values.
- Pros: Not affected by extreme values, gives a better representation of the central location in skewed distributions.
- Cons: Does not consider every data point, so it may not capture the entire variability of the dataset.
Example: Determining the median income of a group of people when there are a few extremely high or low incomes.
Mode:
- Use Mode When: Identifying the most frequently occurring value or category in a dataset, especially for categorical data.
- Pros: Useful for categorical data and discrete distributions. It's not influenced by extreme values.
- Cons: May not exist (data could be bimodal or multimodal with no single mode), and it might not be unique.
Example: Finding the mode of preferred transportation in a survey where respondents choose between car, bus, and bike.
In summary:
- Mean is suitable for symmetric distributions without extreme outliers.
- Median is robust and best for skewed distributions or when extreme values are present.
- Mode is useful for identifying the most common category or value in categorical data.
It's also common to use a combination of these measures to get a more complete picture of the central tendency, especially when describing complex datasets. Additionally, consider the nature of your data and the specific objectives of your analysis when choosing the appropriate measure.
In what scenarios is it most appropriate to use the median, mean, and mode in statistical analysis?
Each measure of central tendency has its own strengths and weaknesses, making it suitable for different situations. Here's a breakdown of when to use the mean, median, and mode:
Mean:
- Use: When the data is normally distributed (bell-shaped curve) and there are no outliers.
- Strengths: Sensitive to changes in all data points, provides a single, concise measure of central tendency.
- Weaknesses: Sensitive to outliers, can be misleading if data is skewed.
Median:
- Use: When the data is skewed (not normally distributed) or there are outliers.
- Strengths: Not affected by outliers, provides a good sense of the "middle" value of the data.
- Weaknesses: Less sensitive to changes in data points than the mean, does not provide as much information about the distribution of the data.
Mode:
- Use: When dealing with nominal or categorical data (data that cannot be ranked), or when identifying the most frequent value in a dataset.
- Strengths: Simple to calculate, easily understood.
- Weaknesses: Does not provide information about the central tendency of the data, may not be unique (multiple modes possible).
Here are some specific scenarios when each measure is most appropriate:
Mean:
- Measuring average income in a population (assuming normal distribution).
- Calculating the average score on an exam (assuming normal distribution).
- Comparing the average weight of two groups of animals (assuming normal distribution).
Median:
- Measuring the average household income in a city with high income inequality (skewed data).
- Finding the "middle" value of test scores when there are outliers (e.g., a student who scored significantly higher than everyone else).
- Comparing the median housing price in two different cities (may have different price distributions).
Mode:
- Identifying the most popular color of cars in a parking lot (nominal data).
- Finding the most common letter grade in a class (ordinal data).
- Determining the most frequent size of shoes sold in a store (categorical data).
It's important to note that the choice of which measure to use depends on the specific research question and the characteristics of the data. Sometimes, it may be helpful to calculate all three measures and compare them to gain a more comprehensive understanding of the data.
