How to calculate t test in Excel?
To calculate a t-test in Excel, you can use built-in functions to analyze two sets of data and determine whether there is a statistically significant difference between their means. Here's a step-by-step guide to performing a two-sample t-test in Excel:
Step 1: Prepare Your Data
Organize your data into two separate columns in an Excel spreadsheet. These columns represent the two sets of data you want to compare. Make sure your data is properly labeled.
For this example, let's assume you have data in columns A and B.
Step 2: Calculate Means and Standard Deviations
In a new cell, calculate the means and standard deviations for each dataset. Use the following Excel functions:
- To calculate the mean for the data in column A, use
=AVERAGE(A1:Ax), where "x" is the last row with data. - To calculate the mean for the data in column B, use
=AVERAGE(B1:Bx). - To calculate the standard deviation for the data in column A, use
=STDEV.P(A1:Ax). - To calculate the standard deviation for the data in column B, use
=STDEV.P(B1:Bx).
Step 3: Calculate the T-Statistic
In a new cell, calculate the t-statistic using the following formula:
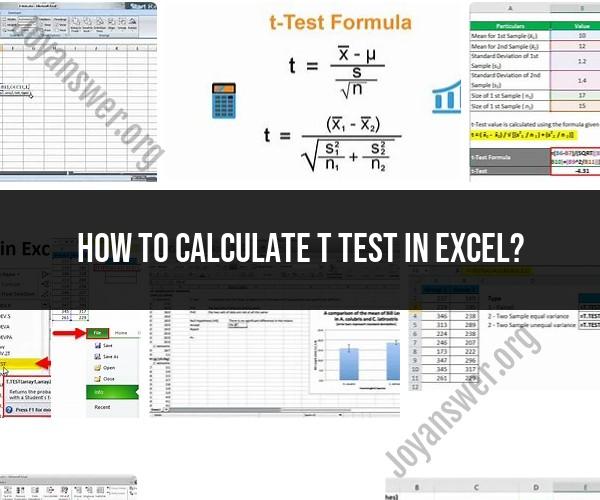
=ABS(mean(A1:Ax) - mean(B1:Bx)) / (SQRT((stdev.p(A1:Ax)^2 / COUNT(A1:Ax)) + (stdev.p(B1:Bx)^2 / COUNT(B1:Bx))))
mean(A1:Ax)andmean(B1:Bx)are the means of the two datasets.stdev.p(A1:Ax)andstdev.p(B1:Bx)are the standard deviations of the two datasets.COUNT(A1:Ax)andCOUNT(B1:Bx)are the sample sizes of the two datasets.
This formula calculates the t-statistic, which measures the difference in means relative to the variability within the datasets.
Step 4: Calculate Degrees of Freedom
In another cell, calculate the degrees of freedom for the t-test using the formula:
=COUNT(A1:Ax) + COUNT(B1:Bx) - 2
COUNT(A1:Ax)andCOUNT(B1:Bx)are the sample sizes of the two datasets.- Subtract 2 from the sum of the sample sizes to calculate the degrees of freedom.
Step 5: Calculate the p-Value
To calculate the p-value associated with the t-statistic, you can use the T.DIST.2T function, which returns the probability of a two-tailed t-test. Use the following formula:
=T.DIST.2T(t-statistic, degrees of freedom)
- Replace "t-statistic" with the cell reference of the calculated t-statistic.
- Replace "degrees of freedom" with the cell reference of the calculated degrees of freedom.
The result is the p-value, which indicates the probability of observing the given difference in means if there were no true difference (i.e., the null hypothesis is true).
Step 6: Analyze the p-Value
Evaluate the p-value to determine the statistical significance of the difference in means. Common significance levels (alpha) are 0.05 or 0.01. If the p-value is less than your chosen alpha level, you can reject the null hypothesis and conclude that there is a statistically significant difference between the two datasets.
By following these steps, you can calculate a two-sample t-test in Excel to assess the significance of differences between two sets of data.
How to Perform a T-Test in Excel: Step-by-Step Guide
To perform a t-test in Excel, follow these steps:
- Enter your data into two columns, one for each group.
- Click the Data tab and then click the Data Analysis button.
- In the Data Analysis dialog box, select t-Test: Two-Sample Assuming Equal Variances and then click OK.
- In the t-Test: Two-Sample Assuming Equal Variances dialog box, select the Variable 1 Range and Variable 2 Range boxes and enter the cell ranges for your data.
- Select the Hypothesized Mean Difference box and enter the value 0. This is the null hypothesis, which states that there is no difference between the means of the two groups.
- Click OK.
Excel will output the results of the t-test to a new worksheet. The results will include the following:
- t-statistic: This is a measure of the difference between the means of the two groups, relative to the standard error of the difference.
- p-value: This is the probability of obtaining a t-statistic as extreme or more extreme than the observed t-statistic, assuming the null hypothesis is true.
Analyzing Data with T-Tests: Excel's Statistical Functions
Excel also has a number of statistical functions that can be used to analyze data with t-tests. For example, the T.TEST function can be used to calculate the t-statistic and p-value for a t-test.
To use the T.TEST function, follow these steps:
- Enter the following formula into a cell:
=T.TEST(array1, array2, tails, type)
- array1: The first data set.
- array2: The second data set.
- tails: The number of tails in the test. 1 for a one-tailed test and 2 for a two-tailed test.
- type: The type of t-test to perform. 1 for a paired t-test and 2 for an unpaired t-test.
- Press Enter.
Excel will output the t-statistic for the t-test to the cell. To calculate the p-value, you can use the following formula:
=1-T.DIST(t_statistic, ABS(df), tails)
- t_statistic: The t-statistic output by the T.TEST function.
- df: The degrees of freedom for the t-test. The degrees of freedom are equal to the number of observations in each group minus 1.
- tails: The number of tails in the test.
- Press Enter.
Excel will output the p-value for the t-test to the cell.
Interpreting T-Test Results for Hypothesis Testing
The p-value is the probability of obtaining a t-statistic as extreme or more extreme than the observed t-statistic, assuming the null hypothesis is true. If the p-value is less than the significance level (alpha), then we reject the null hypothesis and conclude that there is a statistically significant difference between the means of the two groups.
The significance level is typically set to 0.05. This means that we are willing to accept a 5% chance of making a Type I error (rejecting the null hypothesis when it is true).
If the p-value is greater than or equal to the significance level, then we fail to reject the null hypothesis and conclude that there is not enough evidence to support the alternative hypothesis.
It is important to note that a t-test is only a statistical test. It cannot tell us the cause of any difference between the means of the two groups.