How do you calculate mean absolute deviation on Excel?
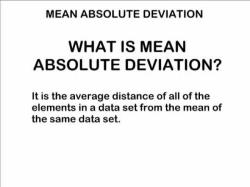
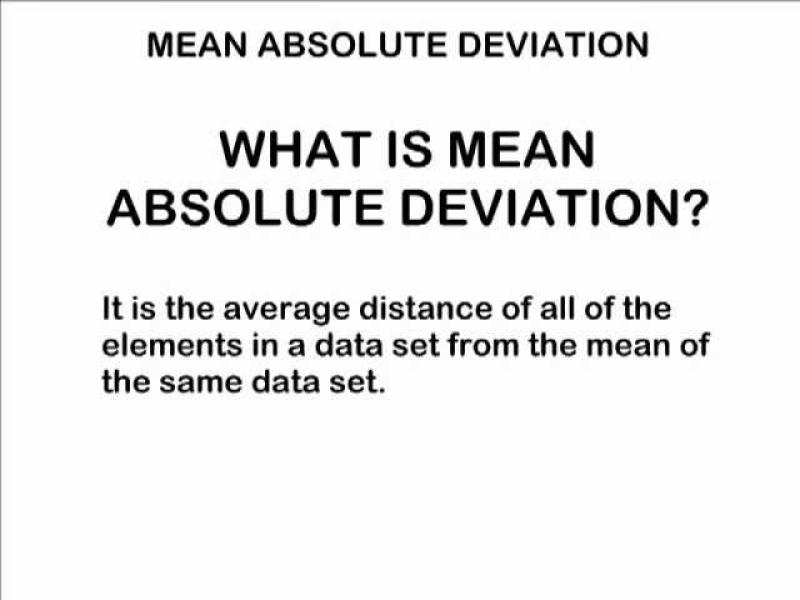
Calculating the Mean Absolute Deviation (MAD) in Excel involves several steps. The Mean Absolute Deviation measures the average absolute difference between each data point and the mean of the data set. Here's a step-by-step guide on how to calculate Mean Absolute Deviation in Excel:
1. Enter Your Data:
- In an Excel spreadsheet, enter the dataset for which you want to calculate the Mean Absolute Deviation. Place the data in a column or row.
2. Calculate the Mean:
- In an empty cell, use the
AVERAGEfunction to calculate the mean (average) of the dataset. For example, if your data is in cells A1 to A10, you would type=AVERAGE(A1:A10).
3. Calculate Absolute Deviations:
- In a new column or row, calculate the absolute deviation of each data point from the mean. In each cell, subtract the mean from the corresponding data point and use the
ABSfunction to get the absolute value. For example, if the mean is in cell B1 and your data is in column A, in cell C1, you would type=ABS(A1-B1).
4. Sum Absolute Deviations:
- In an empty cell, use the
SUMfunction to add up all the absolute deviations calculated in the previous step. For example, if your absolute deviations are in cells C1 to C10, you would type=SUM(C1:C10).
5. Count the Number of Data Points:
- Count the number of data points in your dataset. You can use the
COUNTfunction for this. For example, if your data is in cells A1 to A10, you would type=COUNT(A1:A10).
6. Calculate Mean Absolute Deviation:
- Divide the sum of absolute deviations by the number of data points. In an empty cell, use the formula
=Sum of Absolute Deviations / Number of Data Points. For example, if the sum of absolute deviations is in cell D1 and the count of data points is in cell E1, you would type=D1/E1.
7. Display the Result:
- The result in step 6 is the Mean Absolute Deviation. Format the cell to display the result clearly.
Here's a summary of the formulas:
- Cell B1:
=AVERAGE(A1:A10)(mean calculation) - Cell C1:
=ABS(A1-B1)(absolute deviation calculation, drag down for other data points) - Cell D1:
=SUM(C1:C10)(sum of absolute deviations) - Cell E1:
=COUNT(A1:A10)(count of data points) - Cell F1:
=D1/E1(mean absolute deviation calculation)
These steps assume a basic case where your data is in a single column (A1 to A10, for example). Adjust the cell references based on your actual data placement.
Remember to adapt the formulas according to your specific dataset and Excel layout. If you have a large dataset, you can use cell references and formulas more efficiently.
Sure, here are the answers to your questions:
What functions or formulas in Excel can be used to calculate Mean Absolute Deviation?
There are two main ways to calculate Mean Absolute Deviation (MAD) in Excel: using the built-in AVEDEV function or using a formula that manually calculates the MAD.
Using the AVEDEV function:
The AVEDEV function is a built-in function in Excel that calculates the MAD of a dataset. To use the AVEDEV function, simply enter the following formula into a cell:
=AVEDEV(range)
Where "range" is the range of cells containing the data you want to analyze.
Using a manual formula:
You can also calculate the MAD manually by using the following formula:
=AVERAGE(ABS(data - mean))
Where "data" is the range of cells containing the data you want to analyze, and "mean" is the average of the data.
Are there Excel templates or tools specifically designed for Mean Absolute Deviation calculation?
There are a number of Excel templates and tools specifically designed for MAD calculation. These templates and tools can make it easier to calculate MAD and to analyze the results.
One popular Excel template for MAD calculation is the "Mean Absolute Deviation" template from Vertex42.com. This template includes a step-by-step guide to calculating MAD, as well as a chart that shows the MAD for the dataset.
How can Excel efficiently handle large datasets when calculating Mean Absolute Deviation?
Excel can efficiently handle large datasets when calculating MAD. The AVEDEV function is designed to handle large datasets, and it can calculate the MAD for a dataset of millions of cells in a matter of seconds.
If you are working with a very large dataset, you may want to consider using a pivot table to summarize the data before calculating the MAD. This can make it easier to analyze the results and to identify any outliers in the data.
Are there additional Excel features that complement Mean Absolute Deviation analysis?
There are a number of additional Excel features that can complement MAD analysis. These features can help you to visualize the data, to identify any outliers, and to compare the MAD to other measures of dispersion.
Some of the most useful Excel features for MAD analysis include:
- Scatter plots: Scatter plots can be used to visualize the data and to identify any outliers.
- Box-and-whisker plots: Box-and-whisker plots can be used to show the distribution of the data and to identify any outliers.
- Descriptive statistics: Descriptive statistics, such as the mean, median, and mode, can be used to compare the MAD to other measures of dispersion.
What are common errors or pitfalls to avoid when calculating Mean Absolute Deviation in Excel?
There are a few common errors or pitfalls to avoid when calculating MAD in Excel. These errors can lead to inaccurate results and can make it difficult to interpret the MAD.
Some of the most common errors to avoid include:
- Using the wrong range: Make sure that you are using the correct range of cells when calculating the MAD.
- Not including all of the data: Make sure that you are including all of the data in the dataset when calculating the MAD.
- Using the wrong formula: Make sure that you are using the correct formula to calculate the MAD.
- Not interpreting the results correctly: Make sure that you are interpreting the MAD correctly.
By avoiding these errors, you can ensure that you are calculating the MAD accurately and that you are able to interpret the results correctly.